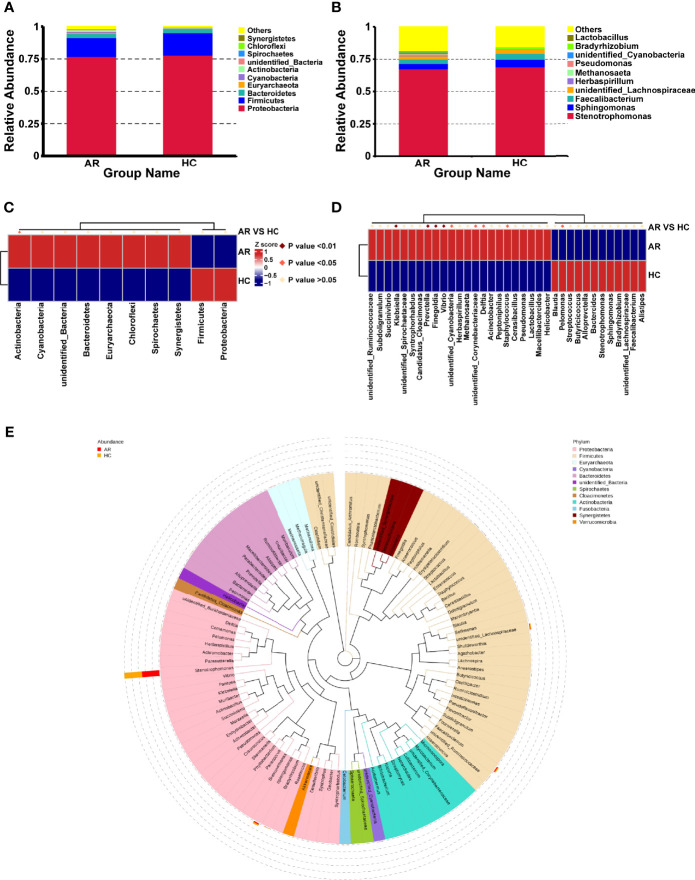
Figure 3.
The distribution of taxa in phylum and genus levels of AR and HC groups. (A) composition of microbiome at the phylum level. (B) composition of microbiome at the genus level. (C) the statistical results of top 10 phyla. (D) the statistical results of top 35 genera. (E) Phylogenetic tree constructed from representative sequences of genus-level species, with branch and fan colors indicating their corresponding gates, and stacked histograms outside the fan rings indicating information on the abundance distribution of the genus in different samples.

