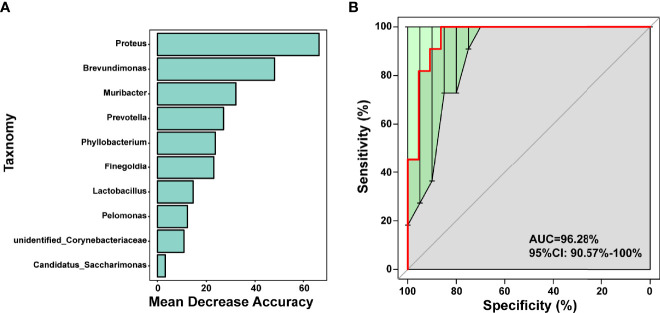
Figure 4.
Prediction model of the airway microbiota for AR status based on the genus-level relative abundances using random forests. (A) variable importance ranking chart, MeanDecreaseAccuracy measures the degree to which the prediction accuracy of a random forest decreases by changing the value of a variable to a random number. A higher value indicates that the variable is more important. (B) ROC curve of the AR model using 10 discriminatory genera.

