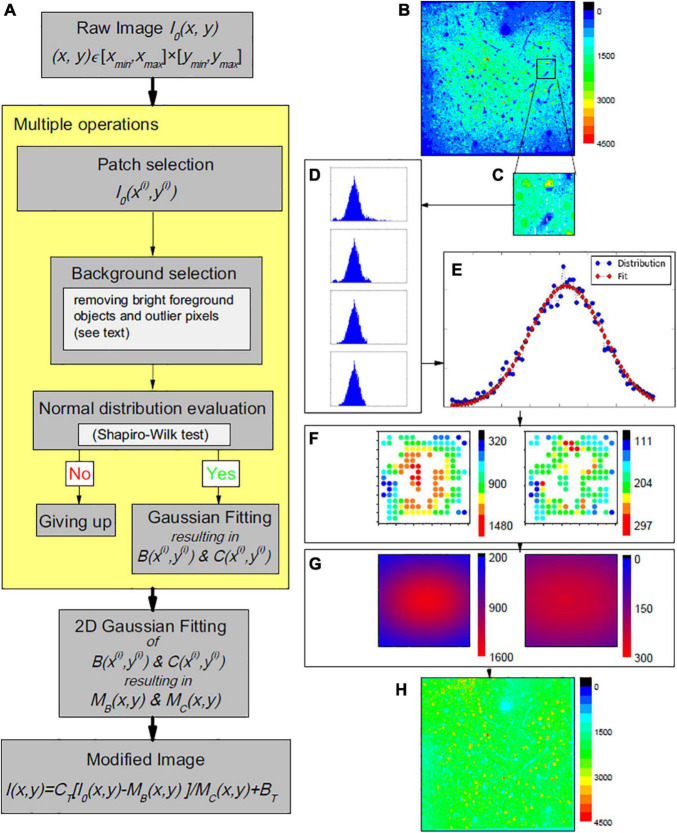
FIGURE 1.
(A) Working pipeline. (B–H) One example of the proposed vignetting correction of a 2-photon microscopy image of mouse area VISp at layers II/III depth (200 μm depth). (B) The original image, i.e., before correction. (C) Example patch selection. (D) Histograms of image pixel intensities, illustrating the effect of the performed outlier reduction. In top-down direction: first, histograms of all pixels in the patch; second, after dropping off the long tail; third, after dropping off some data of certain values at both ends; last, after dropping off additional data of certain amounts at both ends (details given in the source code). At the end, the similarity to a normal distribution estimated by a Shapiro-Wilk test is 0.996, larger than the threshold we used (0.98). (E) Corresponding Gaussian fitting of the background intensity for the patch pixels. (F) Supporting point (i.e., the patch centers) brightness B(x(i),y(i)) (left panel) and contrast C(x(i),y(i)) (right panel). (G) The estimated global brightness distributions MB(x,y) and MC(x,y) (left and right panel). (H) The final modified image.

