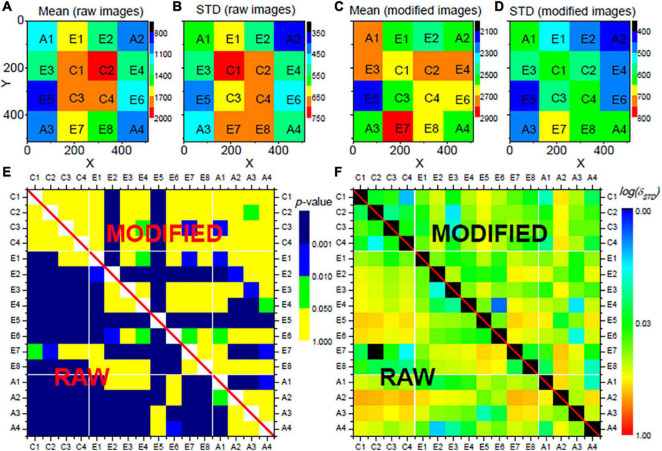
FIGURE 2.
Evaluation results for the proposed vignetting correction for the neural activities Xl in layers II/III of a mouse VISp area. The mouse was located in the home cage. The images stack was evenly divided into 16 regions on x-y plane, as shown in (A–D). (A) Shows the mean activities of all neurons within each region sampled from the raw images, (B) shows their standard deviations. (C,D) Show the mean values and the standard deviations sampled from the modified images. (E) Shows the comparison of the neural activities between each pair of regions, where colors stand for the p-values of a respective t-test with Bonferroni correction. (F) Shows the comparison of the distributions of the neural activities between each pair of regions, where colors indicate δSTD with logarithm scale. In (E,F), the lower rectangles, i.e., the values below the diagonal, show the comparison with the data from the original images. The upper triangles represent corresponding data from the modified images. All parameters for the vignetting correction are the same as applied in Figure 1.

