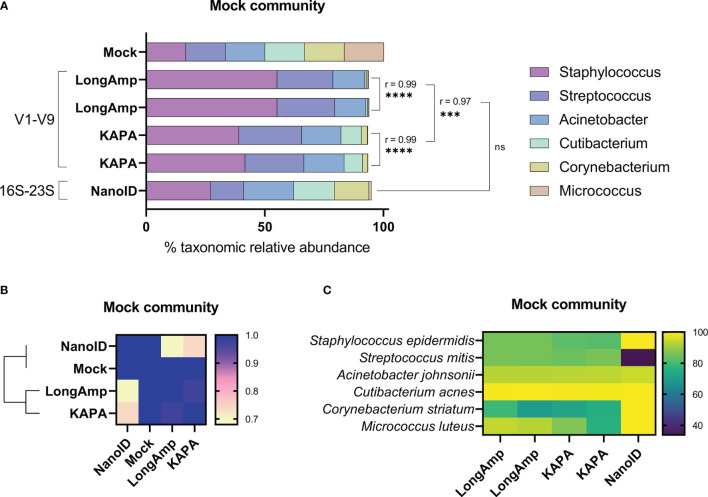
Figure 1.
Testing of different amplification methodologies for MinION™ sequencing of human mock skin microbial communities. (A) Comparison of taxonomic profiles of classified reads of the mock community. The Pearson coefficient (r) between sequencing methods was computed to highlight a significant correlation between samples and/or methodologies. ns, not significant; ***P ≤ 0.001; ****P ≤ 0.0001. (B) Similarity matrix and hierarchical clustering of the methodologies based on their relative abundance profiles. (C) Heat map showing the percentage of classified reads to the correct species between the sequencing methods in the mock community.

