Figure 3.

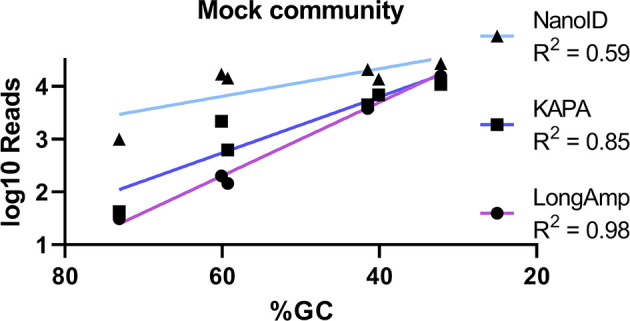
Basic linear regression analysis used to correlate the GC content (%) of mock community skin genera in sequenced samples (x-axis) compared to the number of reads in the MinION™ sequenced samples (y-axis).

Basic linear regression analysis used to correlate the GC content (%) of mock community skin genera in sequenced samples (x-axis) compared to the number of reads in the MinION™ sequenced samples (y-axis).