Fig. 1.

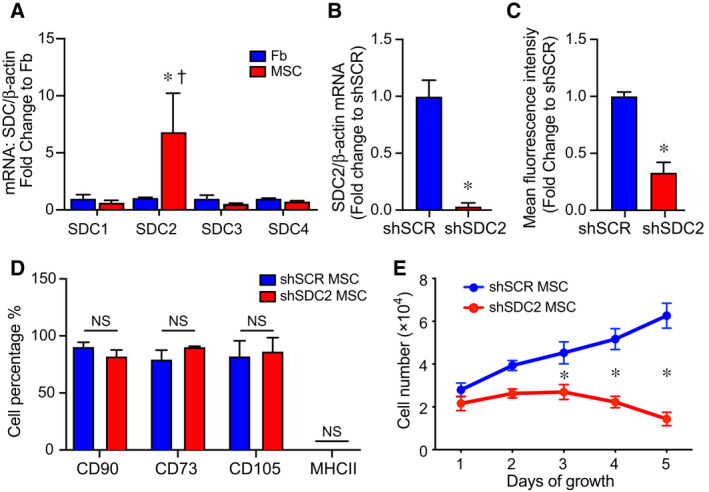
Syndecan‐2 is highly expressed in bone marrow‐derived hMSCs, and silencing results in no change in mesenchymal markers but decreased cell growth. (A) RNA was extracted from human dermal fibroblasts (Fb, blue bars) and bone marrow‐derived hMSCs (MSC, red bars), and qRT‐PCR was performed for SDC1, SDC2, SDC3, and SDC4. Data are presented as mRNA levels of SDCs normalized for β‐actin, as a fold change to Fb, mean ± SEM, n = 3 in each group. *P = 0.032 versus Fb, and † P = 0.03 SDC2 versus other SDCs. (B) RNA was extracted from scrambled control short hairpin construct (shSCR) hMSCs (blue bar) and from silencing of SDC2 (shSDC2, red bar), and qRT‐PCR was performed for SDC2. Data are presented as mRNA levels of SDC2 normalized for β‐actin, as a fold change to shSCR hMSCs, mean ± SEM, n = 3 in each group, *P = 0.0027 versus shSCR. (C) Flow cytometry was also performed for SDC2 in shSCR (blue bar) and shSDC2 (red bar) hMSCs. Data are presented as mean fluorescent intensity, fold change to shSCR hMSCs, mean ± SEM, n = 3 in each group, *P = 0.002 versus shSCR. (D) Flow cytometry was performed for CD90, CD73, CD105, and MHCII in shSCR (blue bar) and shSDC2 (red bar) hMSCs. Data are presented as percentage of cells expressing the markers in each group, mean ± SEM, n = 3 in each group; NS, not significant between groups. (E) shSCR hMSCs (blue dots/line) and shSDC2 (red dots/line) hMSCs were seeded on day 0, and counted daily through day 5. Data are presented as cell number × 104, mean ± SEM, n = 3 experiments in each group, *P = 0.011 shSDC2 versus shSCR hMSC.
