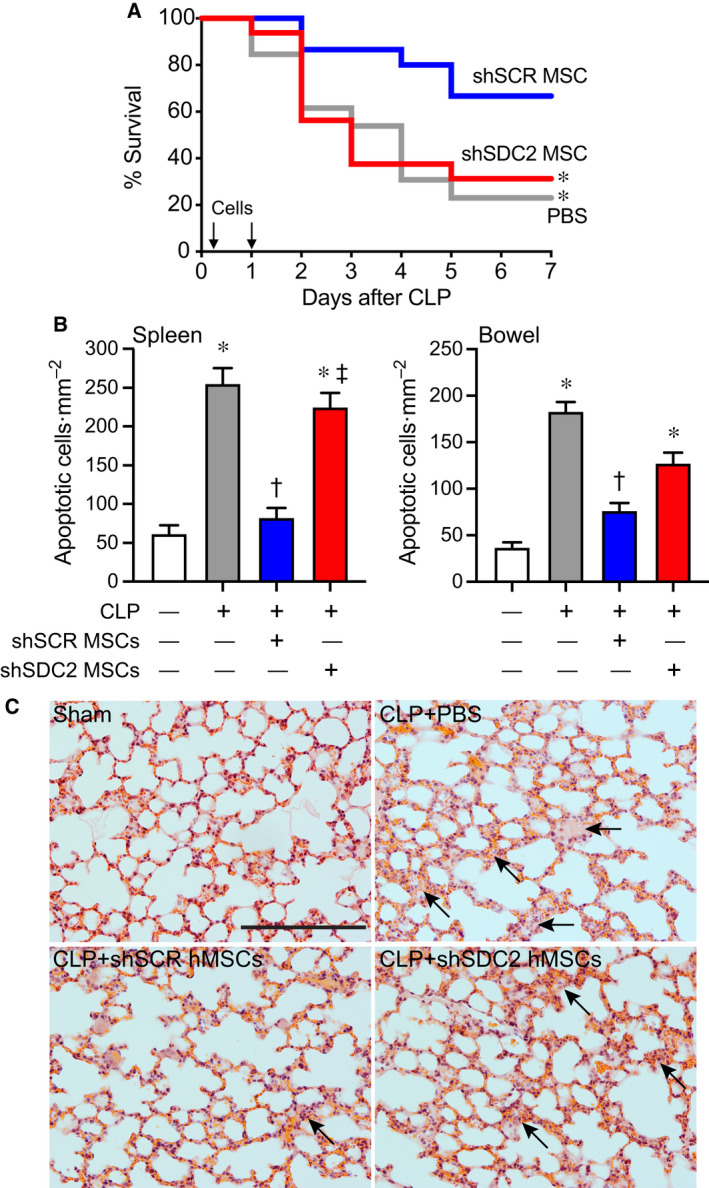
Fig. 2.

Silencing of SDC2 in hMSCs results in decreased survival and increased tissue injury and a lack of bacterial clearance when administered during sepsis. (A) Septic mice were randomly separated into three groups: PBS control (gray line, n = 13), shSCR hMSCs (blue line, n = 15), and shSDC2 hMSCs (red line, n = 16). All mice were subjected to CLP. 2 h after CLP, the mice received PBS (200 µL) or hMSCs (5 × 10⁵ cells in 200 µL PBS) via tail vein injection. This treatment was also repeated at 24 h after CLP. Survival of mice was monitored over 7 days, and data are presented as Kaplan–Meier survival curves, *P = 0.025 versus shSCR hMSC. (B) Tissue injury was assessed by terminal deoxynucleotide transferase‐mediated dUTP nick end‐labeling (TUNEL) staining of spleen (left panel) and bowel (right panel) tissues 48 h after sham (−) or CLP (+) surgery. Data are presented as quantification of apoptotic cells per mm2, mean ± SEM, from random images of fluorescent microscope (×20 objective) in sham (white bars, n = 10 and 13 images, respectively, from left and right panels), CLP+PBS (gray bars, n = 24 and 18, respectively), CLP+shSCR hMSCs (blue bars, n = 27 and 18 images, respectively), and CLP+shSDC2 hMSCs (red bars, n = 27 and 20 images, respectively). P < 0.0001 for spleen and bowel, with significant comparisons * versus sham, † versus PBS, ‡ versus shSCR hMSCs. (C) Lung architecture was assessed by hematoxylin and eosin staining of representative tissue sections from sham (left upper panel), CLP+PBS (right upper panel), CLP+shSCR hMSCs (left lower panel), and CLP+shSDC2 hMSCs (right lower panel). Arrows point to areas of injury. Scale bar represents 100 µm.
