Fig. 3.

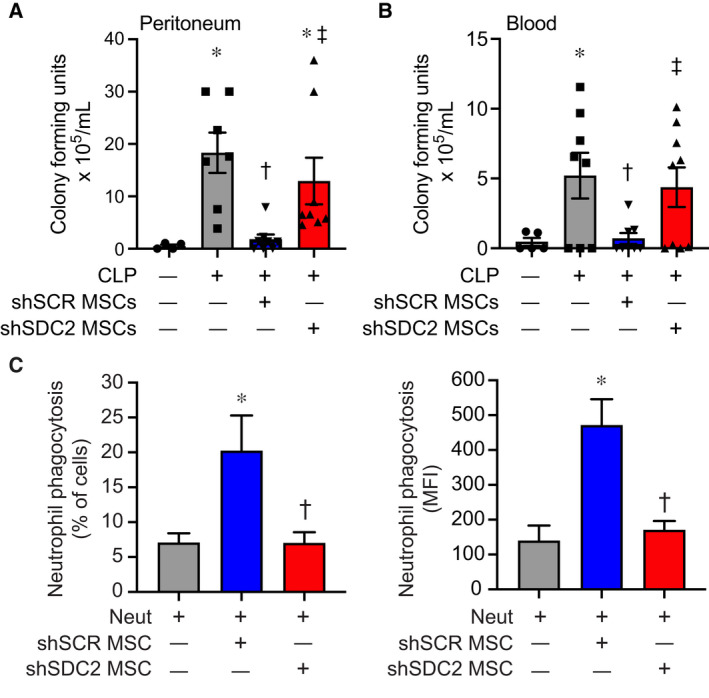
Enhanced bacterial clearance and neutrophil phagocytosis by hMSC are lost after SDC2 silencing. Assessment of bacterial colony‐forming units was assessed in the peritoneum (A) and blood (B) 48 h after sham (circles, n = 4 in peritoneum, n = 5 in blood), PBS+CLP (squares, n = 7 in peritoneum, n = 8 in blood), shSCR hMSCs+CLP (downward triangle, n = 8 in peritoneum and blood), and shSDC2 hMSCs+CLP (upward triangle, n = 8 in peritoneum, n = 9 in blood). Data are depicted graphically as a mean ± SEM. P = 0.003 (A) and P = 0.0004 (B) with significant comparisons * versus sham, † versus PBS, ‡ versus shSCR hMSCs. (C) Isolated neutrophils were incubated with GFP‐labeled Escherichia coli in the presence of no hMSCs (gray bars, n = 4 in each group), shSCR hMSCs (blue bars, n = 3 and 4, respectively), or shSDC2 hMSCs (red bars, n = 3 and 4, respectively). Data are presented as percent of neutrophils phagocytizing bacteria (left panel) or as mean fluorescent intensity (MFI) of bacteria taken up by neutrophils (right panel). Data are presented as mean ± SEM. P = 0.023 for % of neutrophils phagocytizing bacteria, and P = 0.0048 for neutrophil MFI of FITC, with significant comparisons * versus no hMSCs, and † versus shSCR hMSCs.
