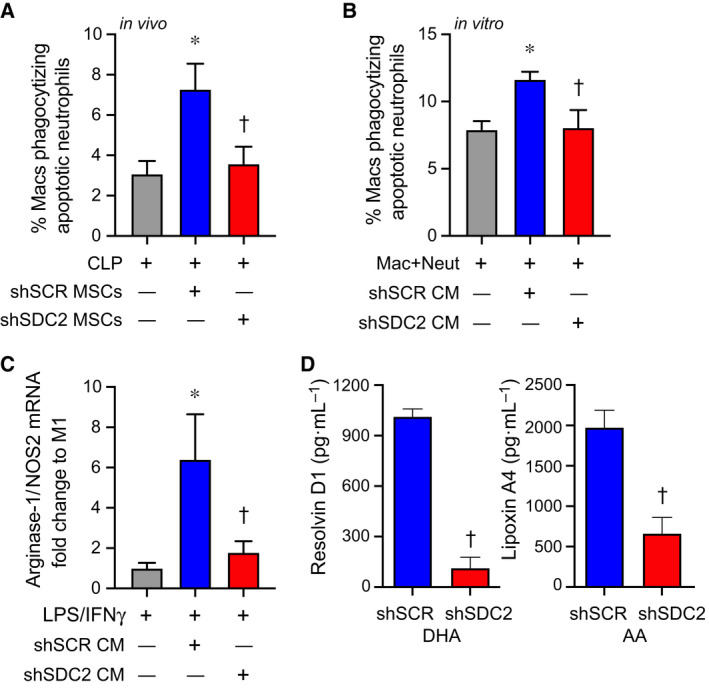
Fig. 7.

SDC2 is important for the paracrine functions of hMSCs to promote efferocytosis and macrophage polarization to an M2‐like phenotype. (A) Mice were subjected to CLP surgery and randomly assigned to receive PBS control (gray bar, n = 6), shSCR hMSCs (blue bar, n = 7), or shSDC2 hMSCs (red bar, n = 6). Efferocytosis was assessed in the peritoneal fluid of septic mice by flow cytometry. Data are presented as the percentage of macrophages phagocytizing apoptotic neutrophils, mean ± SEM. P = 0.015, with significant comparisons * versus PBS and † versus shSCR hMSC. (B) Next, we performed the efferocytosis assay in vitro. Macrophages were exposed to apoptotic neutrophils in the presence of PBS (gray bar, n = 5), CM from shSCR hMSCs (blue bar, n = 5), or CM form shSDC2 hMSCs (red bar, n = 5). Data are presented as the percentage of macrophages phagocytizing apoptotic neutrophils, mean ± SEM. P = 0.021, with significant comparisons * versus PBS and † versus shSCR hMSC. (C) M0 macrophages were stimulated with IFN‐γ (10 ng·mL−1) and LPS (10 ng·mL−1) to induce an M1 phenotype. At the time of LPS/IFN‐γ stimulation, the cells were exposed to PBS (gray bar, n = 4), shSCR CM (blue bar, n = 4), or shSDC2 CM (red bar, n = 4). Macrophage RNA was harvested, and qRT‐PCR was performed to assess arginase‐1/NOS2 ratio as a marker of macrophage polarization, with an increase consistent with M2‐like phenotype. Data are presented as mean ± SEM. P = 0.0048, with significant comparisons * versus PBS and † versus shSCR hMSC. (D) shSCR hMSCs (blue bars, n = 5) and shSDC2 hMSCs (red bars, n = 5) were exposed to SPM substrates DHA or AA for 24 h, and then, the CM from the cells was analyzed by ELISAs for resolvin D1 (left) or lipoxin A4 (right), respectively. Data are presented as mean ± SEM. P < 0.0001, with significance comparison † versus CM of shSCR hMSCs.
