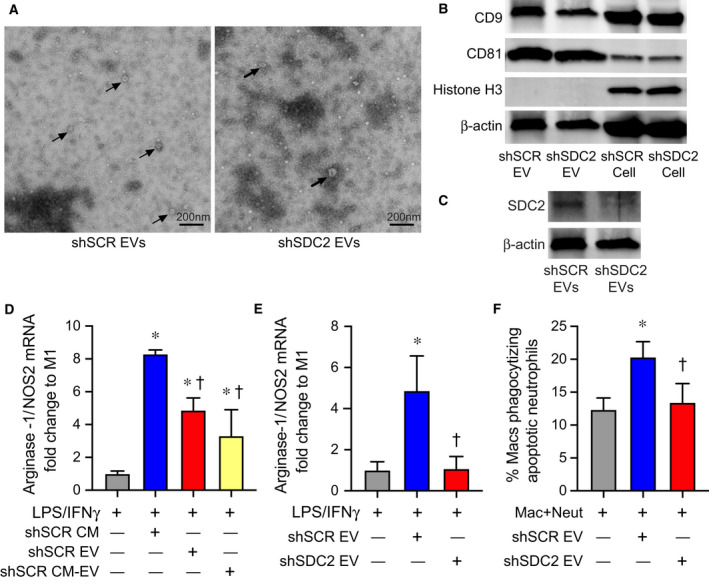
Fig. 8.

Extracellular vesicles secreted by shSDC2 hMSCs lose the ability to promote efferocytosis and macrophage polarization to an M2‐like phenotype. (A) TEM was performed on EVs harvested from shSCR hMSCs (left panel) and shSDC2 hMSCs (right panel). Arrows point to representative EVs. Scale bar represents 200 nm. (B) EVs isolated from shSCR hMSCs and shSDC2 hMSCs were characterized by western blot analyses, using antibodies to CD9 and CD81 as markers of EVs, and histone H3 as a negative control of EVs (upper panel). Total cell protein lysate was loaded as a control, and β‐actin was used to signify total protein content. (C) EVs isolated from shSCR hMSCs and shSDC2 hMSCs were also characterized by western blot analyses, using an antibody to SDC2 (lower panel). Total cell protein lysate was loaded as a control, and β‐actin was used to signify total protein content. (D) M0 macrophages were stimulated with IFN‐γ (10 ng·mL−1) and LPS (10 ng·mL−1) to induce an M1 phenotype. At the time of LPS/IFN‐γ stimulation, the cells were exposed to PBS (gray bar, n = 4), shSCR CM (blue bar, n = 4), shSCR EV (red bar, n = 5), or shSCR CM depleted of EVs (shSCR CM‐EV, yellow bar, n = 3). Macrophage RNA was harvested, and qRT‐PCR was performed to assess the arginase‐1/NOS2 ratio as a marker of macrophage polarization. Data are presented as mean ± SEM. P < 0.0001, with significant comparisons * versus PBS and † versus shSCR hMSC. (E) M0 macrophages were stimulated with IFN‐γ (10 ng·mL−1) and LPS (10 ng·mL−1) to induce an M1 phenotype. At the time of LPS/IFN‐γ stimulation, the cells were exposed to PBS (gray bar, n = 5), shSCR EV (blue bar, n = 4), or shSDC2 EV (red bar, n = 5). Macrophage RNA was harvested, and qRT‐PCR was performed to assess the arginase‐1/NOS2 ratio as a marker of macrophage polarization. Data are presented as mean ± SEM. P = 0.005, with significant comparisons * versus PBS and † versus shSCR hMSC. (F) Macrophages were exposed to apoptotic neutrophils in the presence of PBS (gray bar, n = 7), shSCR EV (blue bar, n = 7), or shSDC2 EV (red bar, n = 7). Data are presented as the percentage of macrophages phagocytizing apoptotic neutrophils, mean ± SEM. P = 0.0027, with significant comparisons * versus PBS and † versus shSCR hMSC.
