Fig. 9.

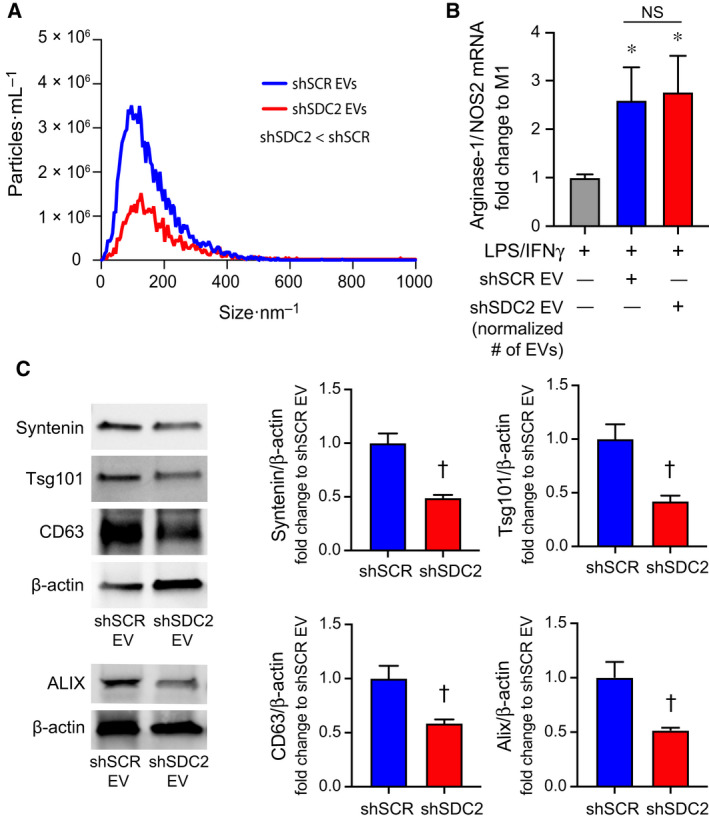
Silencing of SDC2 in hMSC reduces EV production. A) EVs were counted by NTA after harvesting EVs from an equivalent number of shSCR hMSCs (blue line, n = 3) and shSDC2 hMSCs (red line, n = 3). Data are presented as the mean of the experiments, particles per mL over the size distribution per nm, assessed by the area under the curve. P = 0.0005, with significant difference between shSCR and shSDC2 EVs. (B) M0 macrophages were stimulated with IFN‐γ (10 ng·mL−1) and LPS (10 ng·mL−1) to induce an M1 phenotype. At the time of LPS/IFN‐γ stimulation, the cells were exposed to PBS (gray bar, n = 7), shSCR EV (blue bar, n = 8), or shSDC2 EV (number normalized to shSCR EV, red bar, n = 7). Macrophage RNA was harvested, and qRT‐PCR was performed to assess the arginase‐1/NOS2 ratio as a marker of macrophage polarization. Data are presented as mean ± SEM. P = 0.0008, with significant comparisons * versus PBS. NS, not significant. (C) EVs isolated from shSCR hMSCs and shSDC2 hMSCs were characterized by western blot analyses (left panels), using antibodies to syntenin (n = 4), Tsg101 (n = 4), CD63 (n = 4), and ALIX (n = 3), markers of exosome biogenesis. β‐Actin was used to normalize for total protein content. The western blot data were quantified protein/β‐actin, fold change to shSCR (right panels), and presented as mean ± SEM. P = 0.0017, syntenin; P = 0.0078, Tsg101; P = 0.016, CD63; and P = 0.031, ALIX. Significant comparison † versus shSCR.
