
FIGURE 5.
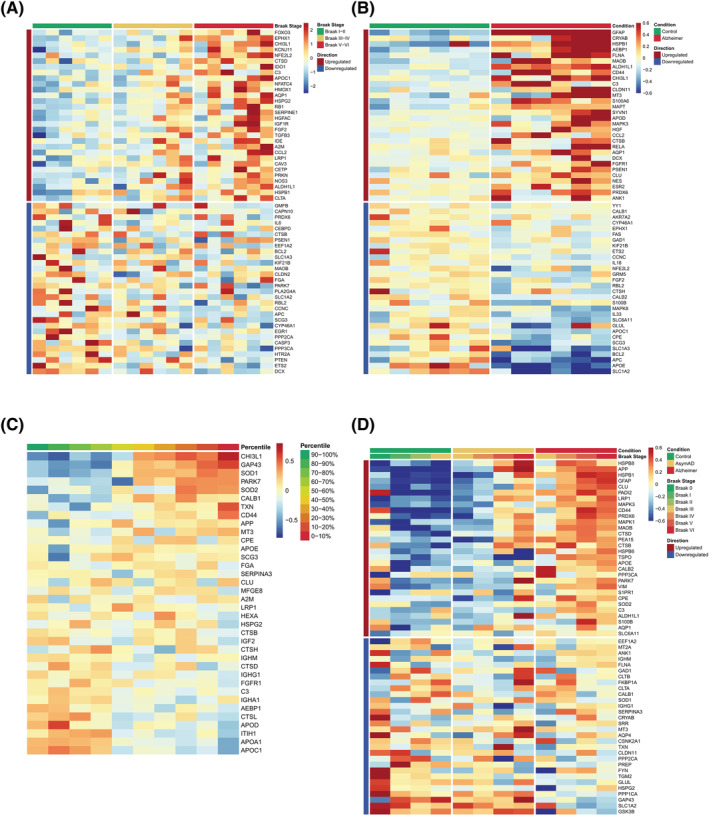
Comparison of Alzheimer's disease reactive astrocytes (ADRA) protein set with publicly available human ‐omics datasets. (A) Heatmap shows the z scores of gene expression of the top 30 upregulated and downregulated ADRA markers across all 18 subjects (n = 6 Braak I/II, n = 6 Braak III/IV and n = 6 Braak V/VI) included in a microarray study of laser‐capture microdissected GFAP+ astrocytes from the temporal neocortex (Simpson et al. [27]). (B) Heatmap shows the z scores of gene expression of the top 30 upregulated and downregulated ADRA markers across all 12 subjects (n = 6 control and n = 6 AD) included in a single nuclei RNA‐sequencing (RNA‐seq) study from the entorhinal cortex (Grubman et al. [28]). (C) Heatmap represents the z scores of protein expression of all available ADRA markers averaged by deciles of cerebrospinal fluid (CSF) Aβ42/p‐tau ratio across the n = 147 control and n = 150 AD subjects from Cohort 1 of the Accelerating Medicines Partnership‐Alzheimer's Disease (AMP‐AD) Consortium CSF proteomic study (Johnson et al. [29]). (D) Heatmap illustrates the z scores of protein expression of the top 30 upregulated and downregulated ADRA markers averaged by Braak neurofibrillary tangle (NFT) stage within each diagnostic group (n = 91 control, n = 98 asymptomatic AD and n = 230 AD dementia subjects) described in the AMP‐AD Consortium bulk brain proteomic dataset (Johnson et al. [29])