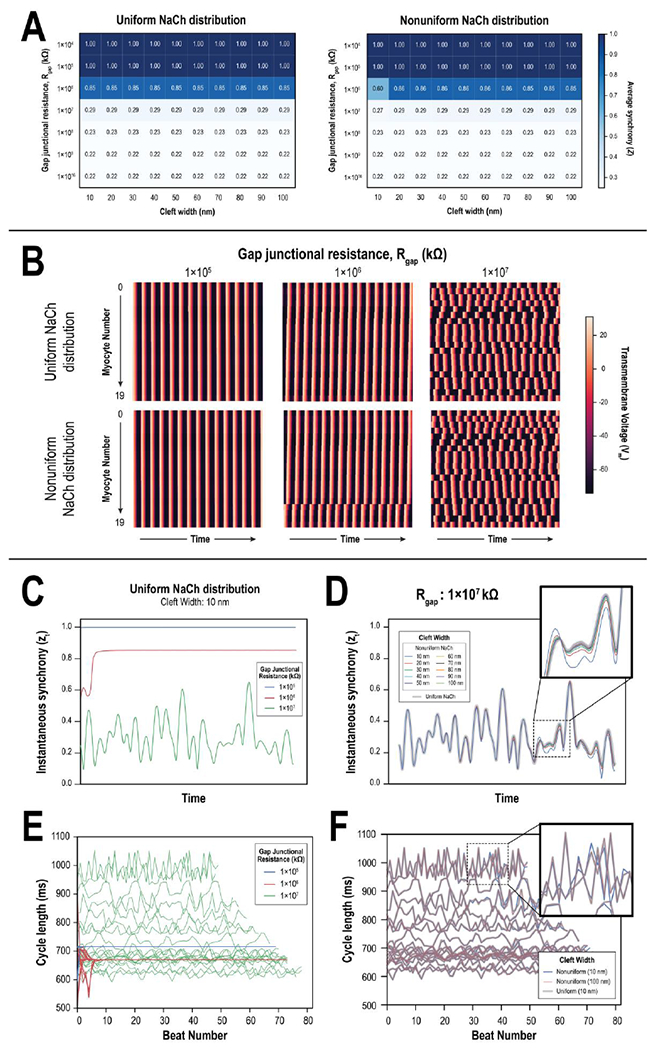
Figure 2: Graft dynamics with respect to gap junctional coupling, ID cleft width, and NaCh distribution.

(A) Heat maps of average synchrony across combinations of gap junctional resistances (Rgap) and cleft widths for 20 linearly coupled PSC-CMs with either uniform (left) and nonuniform (right) NaCh distributions. (B) Color maps denote the temporal evolution of transmembrane potential (Vm) across all 20 PSC-CMs at 3 different levels of Rgap (1×10⁵ kΩ, left; 1×10⁶ kΩ, middle; 1×10⁷ kΩ, right) when NaChs were distributed uniformly (top) and nonuniformly (bottom); cleft width was 10 nm. When Rgap=1×10⁶ kΩ and NaChs were nonuniformly distributed (middle, bottom), myocytes 16-19 were synchronized but remained asynchronous from the rest. (C) Instantaneous synchrony vs. time across Rgap values in panel (B); NaChs were uniformly distributed, and cleft width was 10 nm. (D) Instantaneous synchrony vs. time across different cleft widths when Rgap=1×10⁷ kΩ and NaChs were uniformly and nonuniformly distributed. Differences between the traces were more pronounced at particular instances in time (inset). (E) Line plots of individual PSC-CM cycle length (CL) vs. beat number across Rgap values in panel (B); NaChs were uniformly distributed, and cleft width was 10 nm. (F) Line plots of cycle length vs. beat number demonstrating slight changes between uniform and nonuniform NaCh distributions when Rgap=1×10⁷ kΩ. Differences were more pronounced for slower beating PSC-CMs (inset).
