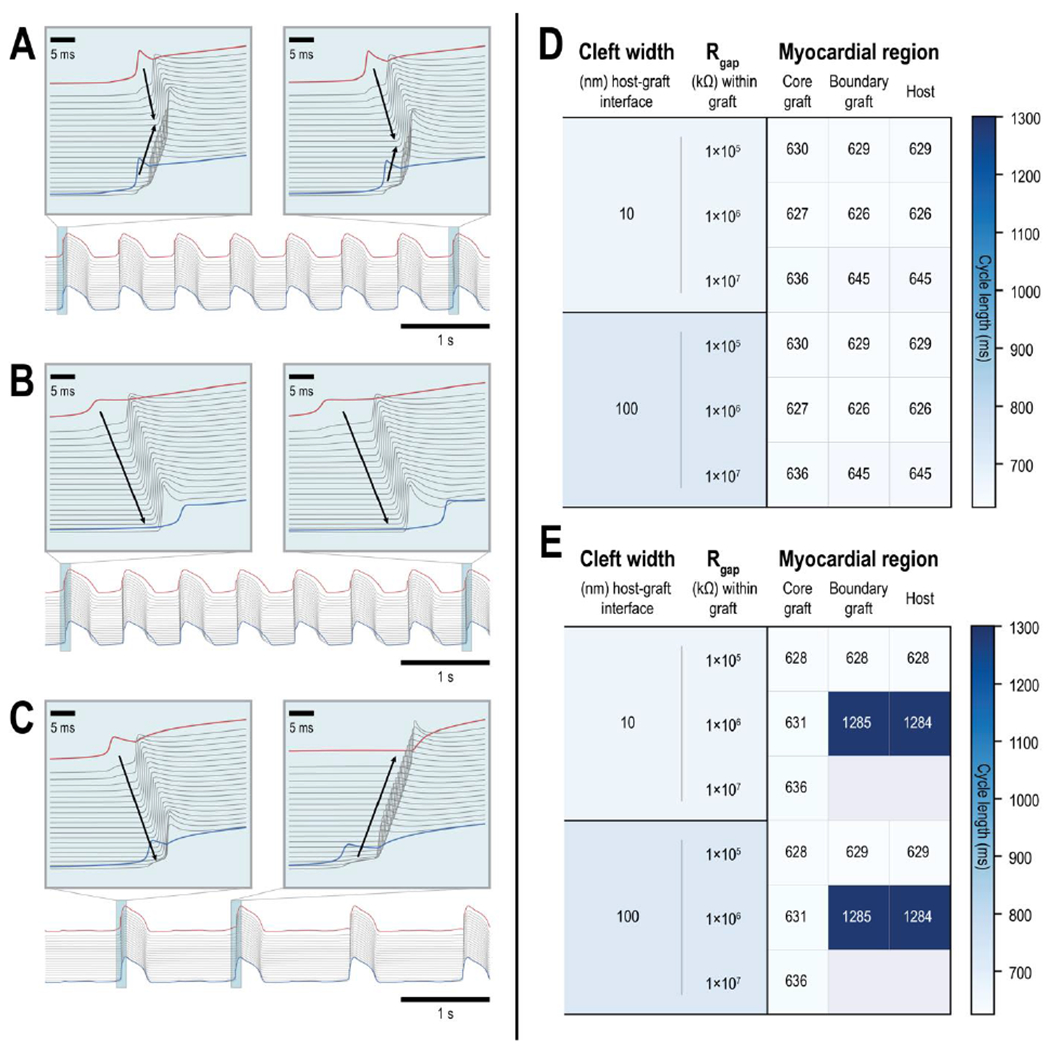
Figure 5: Graft-induced spontaneous ectopic propagations in a myocardial ring model.

(A-C) Action potential (AP) traces of the 2 boundary graft PSC-CMs (one at either end of the graft, red and blue traces) and all 20 host CMs (grey) demonstrate a variety of graft-induced spontaneous ectopic propagations. (A) An instance where ectopic beats emerged from both ends of the graft myocardium; electrical waves consistently emerged from distal ends of the graft and collide in the host myocardium (inset). (B) An instance where ectopic beats only emerged from one side of the graft; ectopic beats (inset) were triggered by a particular boundary PSC-CM (red) and electrical waves propagated across the host myocardium to the other distal boundary PSC-CM (blue). (C) An instance where ectopic beats emerged from different ends of the graft. The first ectopic beat (inset, left) was triggered by a particular boundary PSC-CM (red) but subsequent ectopic beats (inset, right) emerged from the other boundary PSC-CM (blue). (D-E) Heat maps show the average cycle lengths of spontaneously beating core and boundary PSC-CMs (left and middle columns, respectively) and graft-induced ectopic propagations across ventricular CMs in the host myocardium (right column) across different graft coupling configurations. Within the graft, three different values of gap junctional resistance (1×10⁵, 1×10⁶, and 1×10⁷ kΩ) were tested in combination with ID cleft widths of (D) 10 and (E) 100 nm. Gap junctional resistance at the host graft interface was 3.4×10⁴ kΩ and ID cleft widths of 10 and 100 nm (top and bottom, respectively) were also tested. (E) Instances of 2:1 capture and complete block were observed between core and boundary PSC-CMs when ID cleft width was 100 nm between PSC-CMs in the graft.
