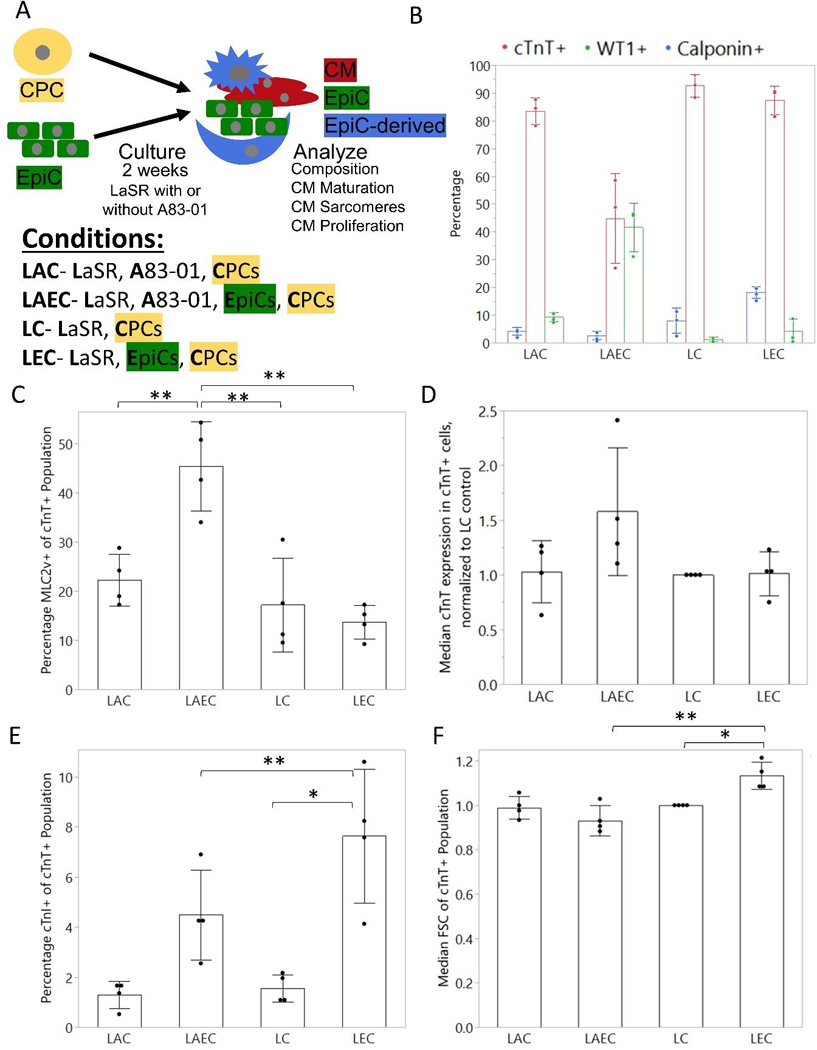
Figure 1:
Description and analysis of EpiC and CPC coculture composition. (A) Schematic of coculture experiments. Cardiac progenitor cells (CPCs) were seeded with epicardial cells (EpiCs) at a 1:1 ratio and cultured for two weeks with or without TGFβ inhibitor A83–01 in direct contact coculture. (B) Percentage of cTnT+, WT1+, and Calponin+ cells at the end of the two week cocultures assessed by flow cytometry. (C) Percentage MLC2v+ of the cTnT+ population. (D) Mean fluorescence intensity (MFI) of cTnT expression in cTnT+ cells, normalized to EpiC samples to control for variability between flow cytometry experiments. (E) Percentage cTnI+ cells in cTnT+ population (F) Normalized median FSC-A of cTnT+ population. Dots represent the average of one well from 3–4 independent differentiations. Bars represent the average across 3–4 differentiations and error bars represent the standard deviation. Statistics are ANOVA with Tukey’s post hoc test using raw data where * is p<0.05 and ** is p<0.01.

