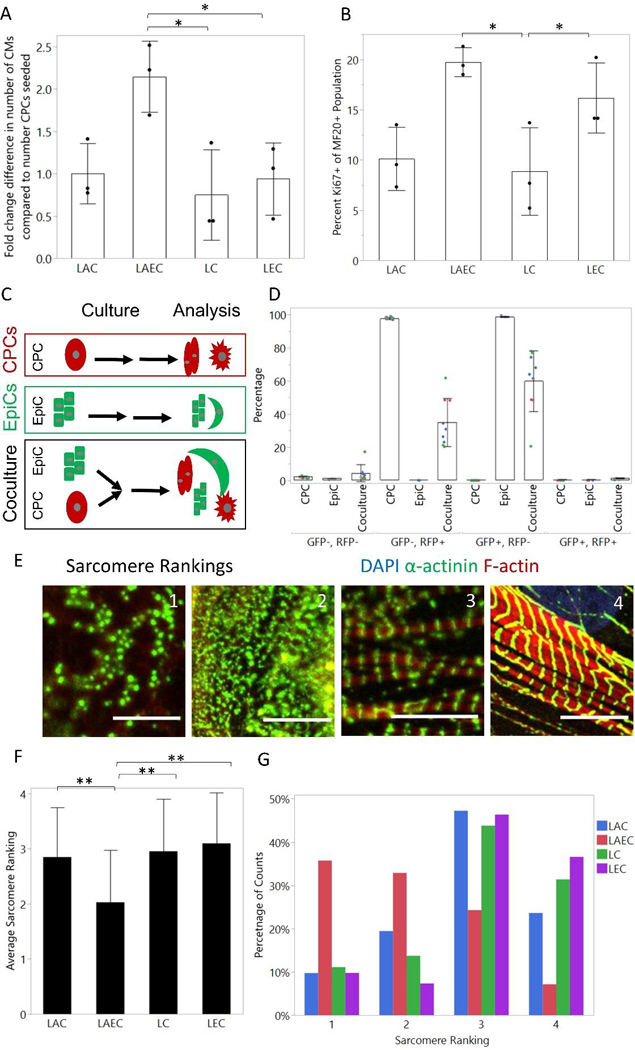
Figure 2: LAEC cocultures cause CM proliferation and reduce sarcomere organization.
(A) Fold change difference in number of CMs at day 20 compared to seeding measured by total number of cTnT+ cells at end of coculture divided by the number of CPCs seeded. (B) Percentage Ki67+ cells of MF20+ population as measured by flow cytometry. Dots represent the average of one well from three differentiations. Bars represent the average across 3 differentiations and error bars represent the standard deviation. Statistics are one-way ANOVA with Tukey’s post-hoc test where * is p<0.05 and ** is p<0.01. (C) Schematic of cell fusion experiment. CPCs were differentiated in the WTC-CAAX-RFP line and EpiCs were differentiated in the WTC-LMNB1-eGFP line. After the two-week coculture, samples were analyzed by flow cytometry. (D) Percentage GFP−/RFP−; GFP−/RFP+; GFP+/RFP−; and GFP+/RFP+. Dots represent well replicates (n=3) and colors represent 3 independent differentiations. Bars represent the average across 3 differentiations and error bars represent the standard deviation. (E) Example images of sarcomere rankings. Scale bar is 10 μm. (F) Average sarcomere rating from blinded image analysis of CMs in coculture and monoculture conditions. Images were from 3 independent CM differentiations with 3 wells per differentiation and a total of at least 40 cells per condition. Bar graph represents the average across all differentiations and the error bars represent the standard deviation. Statistics are ANOVA two-way test with Tukey’s post-hoc test, where * is p<0.05 and ** is p<0.01. (G) Histogram of sarcomere ranking scores for each monoculture and coculture condition across all differentiations.

