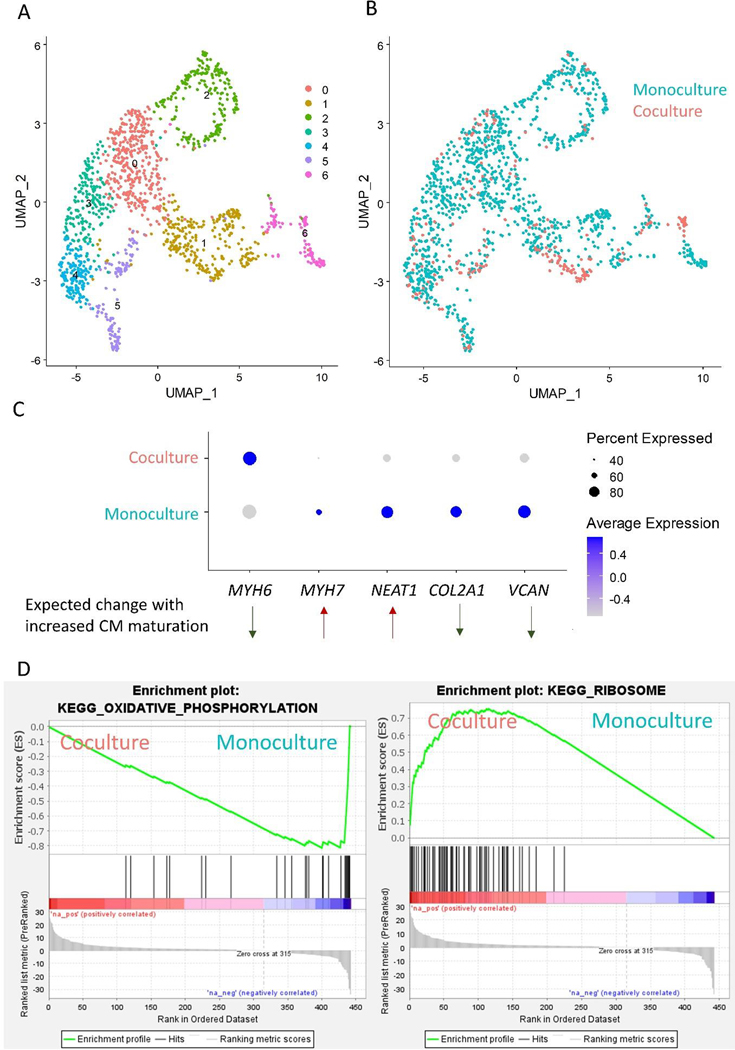
Figure 5: Sub-clustering of hPSC-CMs in scRNA-seq dataset.
(A) Subclustering and UMAP projections of CMs from data in Figure 4 (Clusters 5, 12, 16, and 18, determined by high expression of sarcomere protein encoding genes). (B) Feature plot of cells from monoculture and coculture conditions. (C) Dot plot highlighting cells from monoculture and coculture conditions. Genes selected were differentially expressed in this dataset and two single cell sequencing datasets of hPSC-CM differentiation and maturation during extended culture (E-MTAB-6268)[27,37]. Direction of differential expression was further validated in three bulk sequencing datasets of hPSC-CM maturation (GSE154294, GSE64189, and GSE81585) [30–32] and a single cell sequencing dataset of human heart CM development (GSE106118) [33]. (D) GSEA Enrichment plots of KEGG pathways enriched in monoculture and cocultured CMs.

