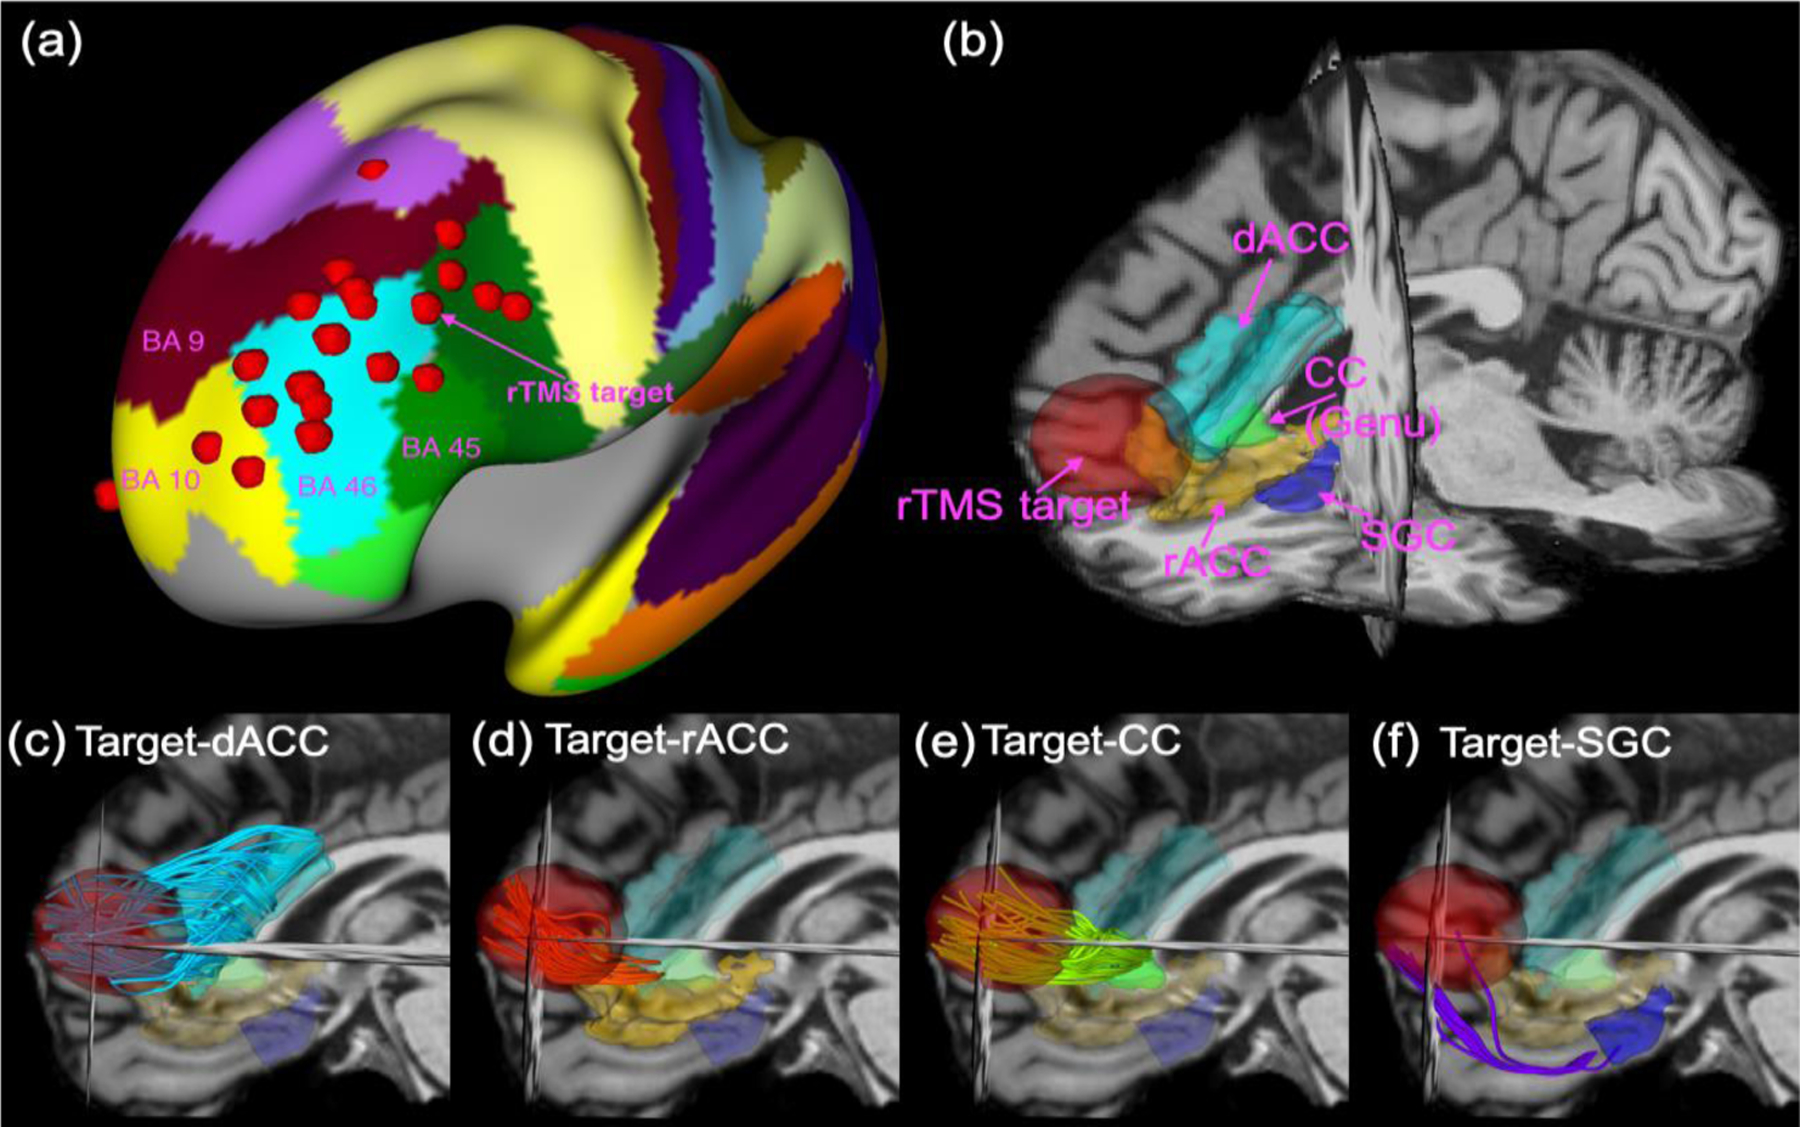
Figure 2:

The red dots in (a) illustrate the stimulation targets of 21 subjects mapped on the cortical surface in the MNI space with the background being the label maps for the Brodmann areas. Fig. (b) illustrates the target region, i.e. 15-mm-radius ball around the maximum of E-field intensity, and four MDD-related deep-brain regions, including the dACC, rACC, CC and SGC for one representative subject. Figs. (c)-(f) illustrate the fiber bundles from diffusion-MRI tractography that connect the stimulation target to the dACC, the rACC, the genu of CC and the SGC, respectively.
