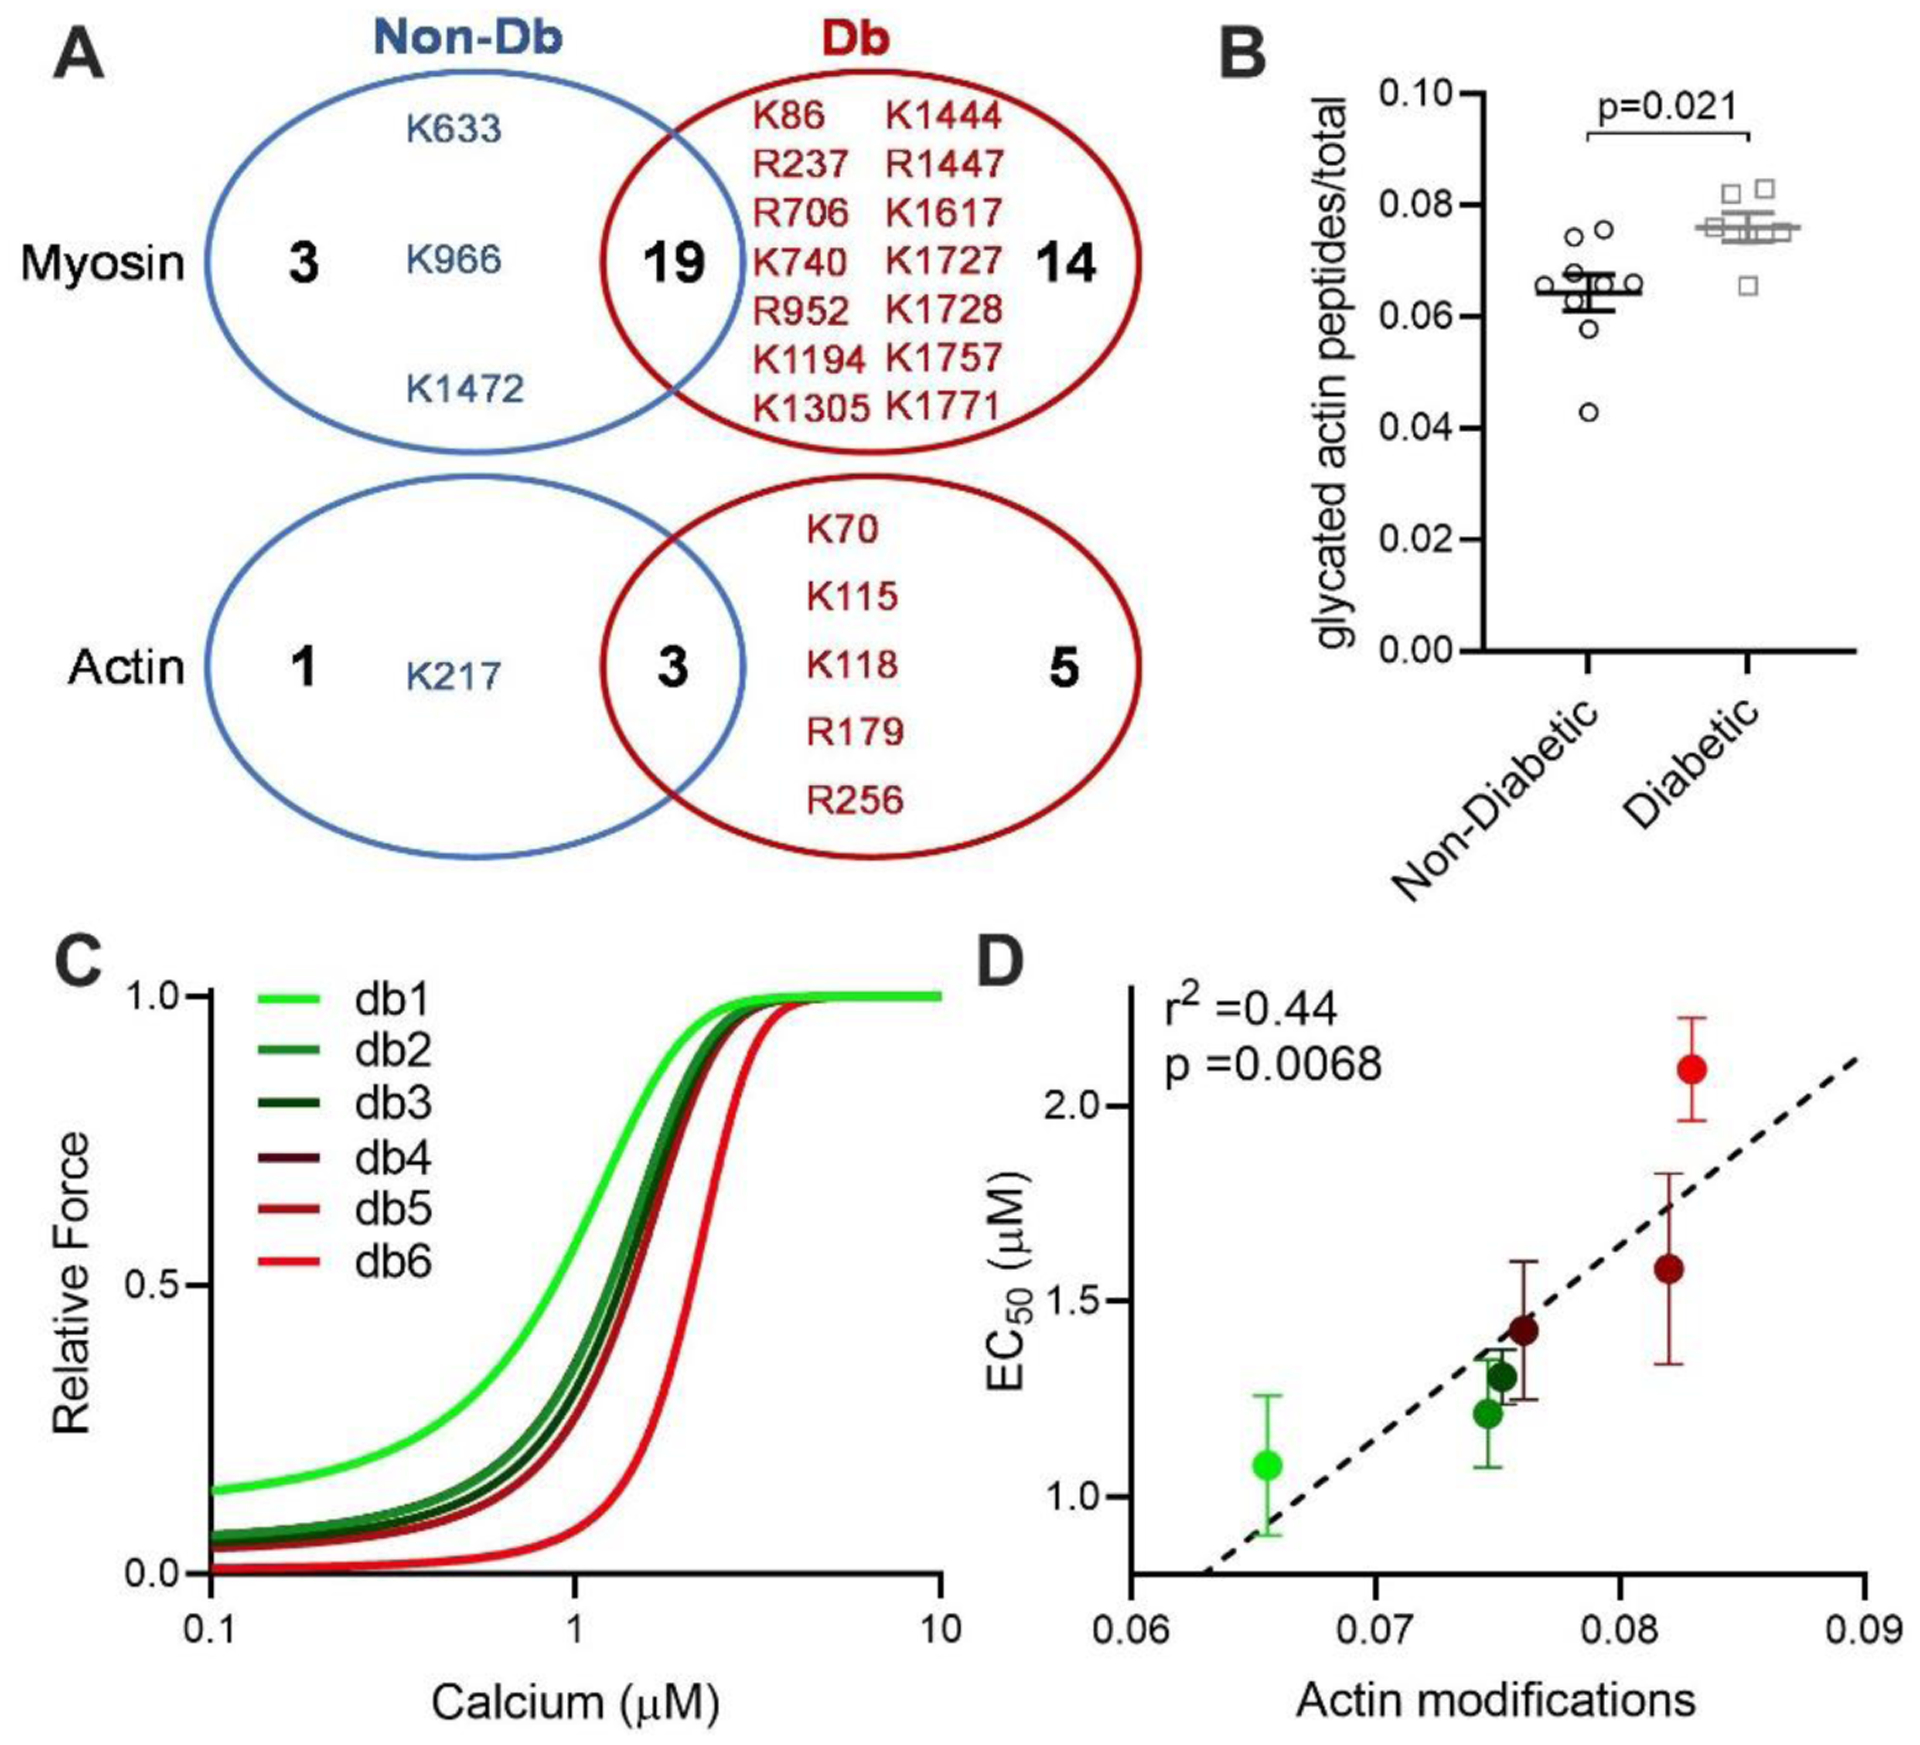
Figure 1: Glycation of sarcomeric actin was increased in Diabetic compared to Non-Diabetic subjects and correlates with decreased myofilament calcium sensitivity.

(A) Unique glycated residues identified in either Non-Diabetic (Non-Db, blue) or Diabetic (Db, red) samples for myosin (top) and actin (bottom). (B) Glycated peptides normalized to total peptides as measured by mass spectrometry on actin, from Non-Diabetic (black circles, n=9) and Diabetic (grey squares, n=6) left ventricular tissue. Statistical comparison by Student’s t-test. (C) Mean fitted curves for force as a function of calcium concentration in human skinned myocytes isolated from Diabetic subjects (n=3–4 myocytes per subject, n=6 subjects) for the subject with the lowest (db1, green) to highest level of actin glycation (db6, red), showing progressive desensitization to calcium in subjects with increased glycation. (D) Mean EC50 as a function of total actin glycation detected by mass spectrometry for each human Diabetic sample (circles colour coded from the lowest glycation level, bright green to highest glycation level, bright red, n=6). The data are described by a positive correlation (dashed line, r2=0.44, p=0.0068 by linear regression.
