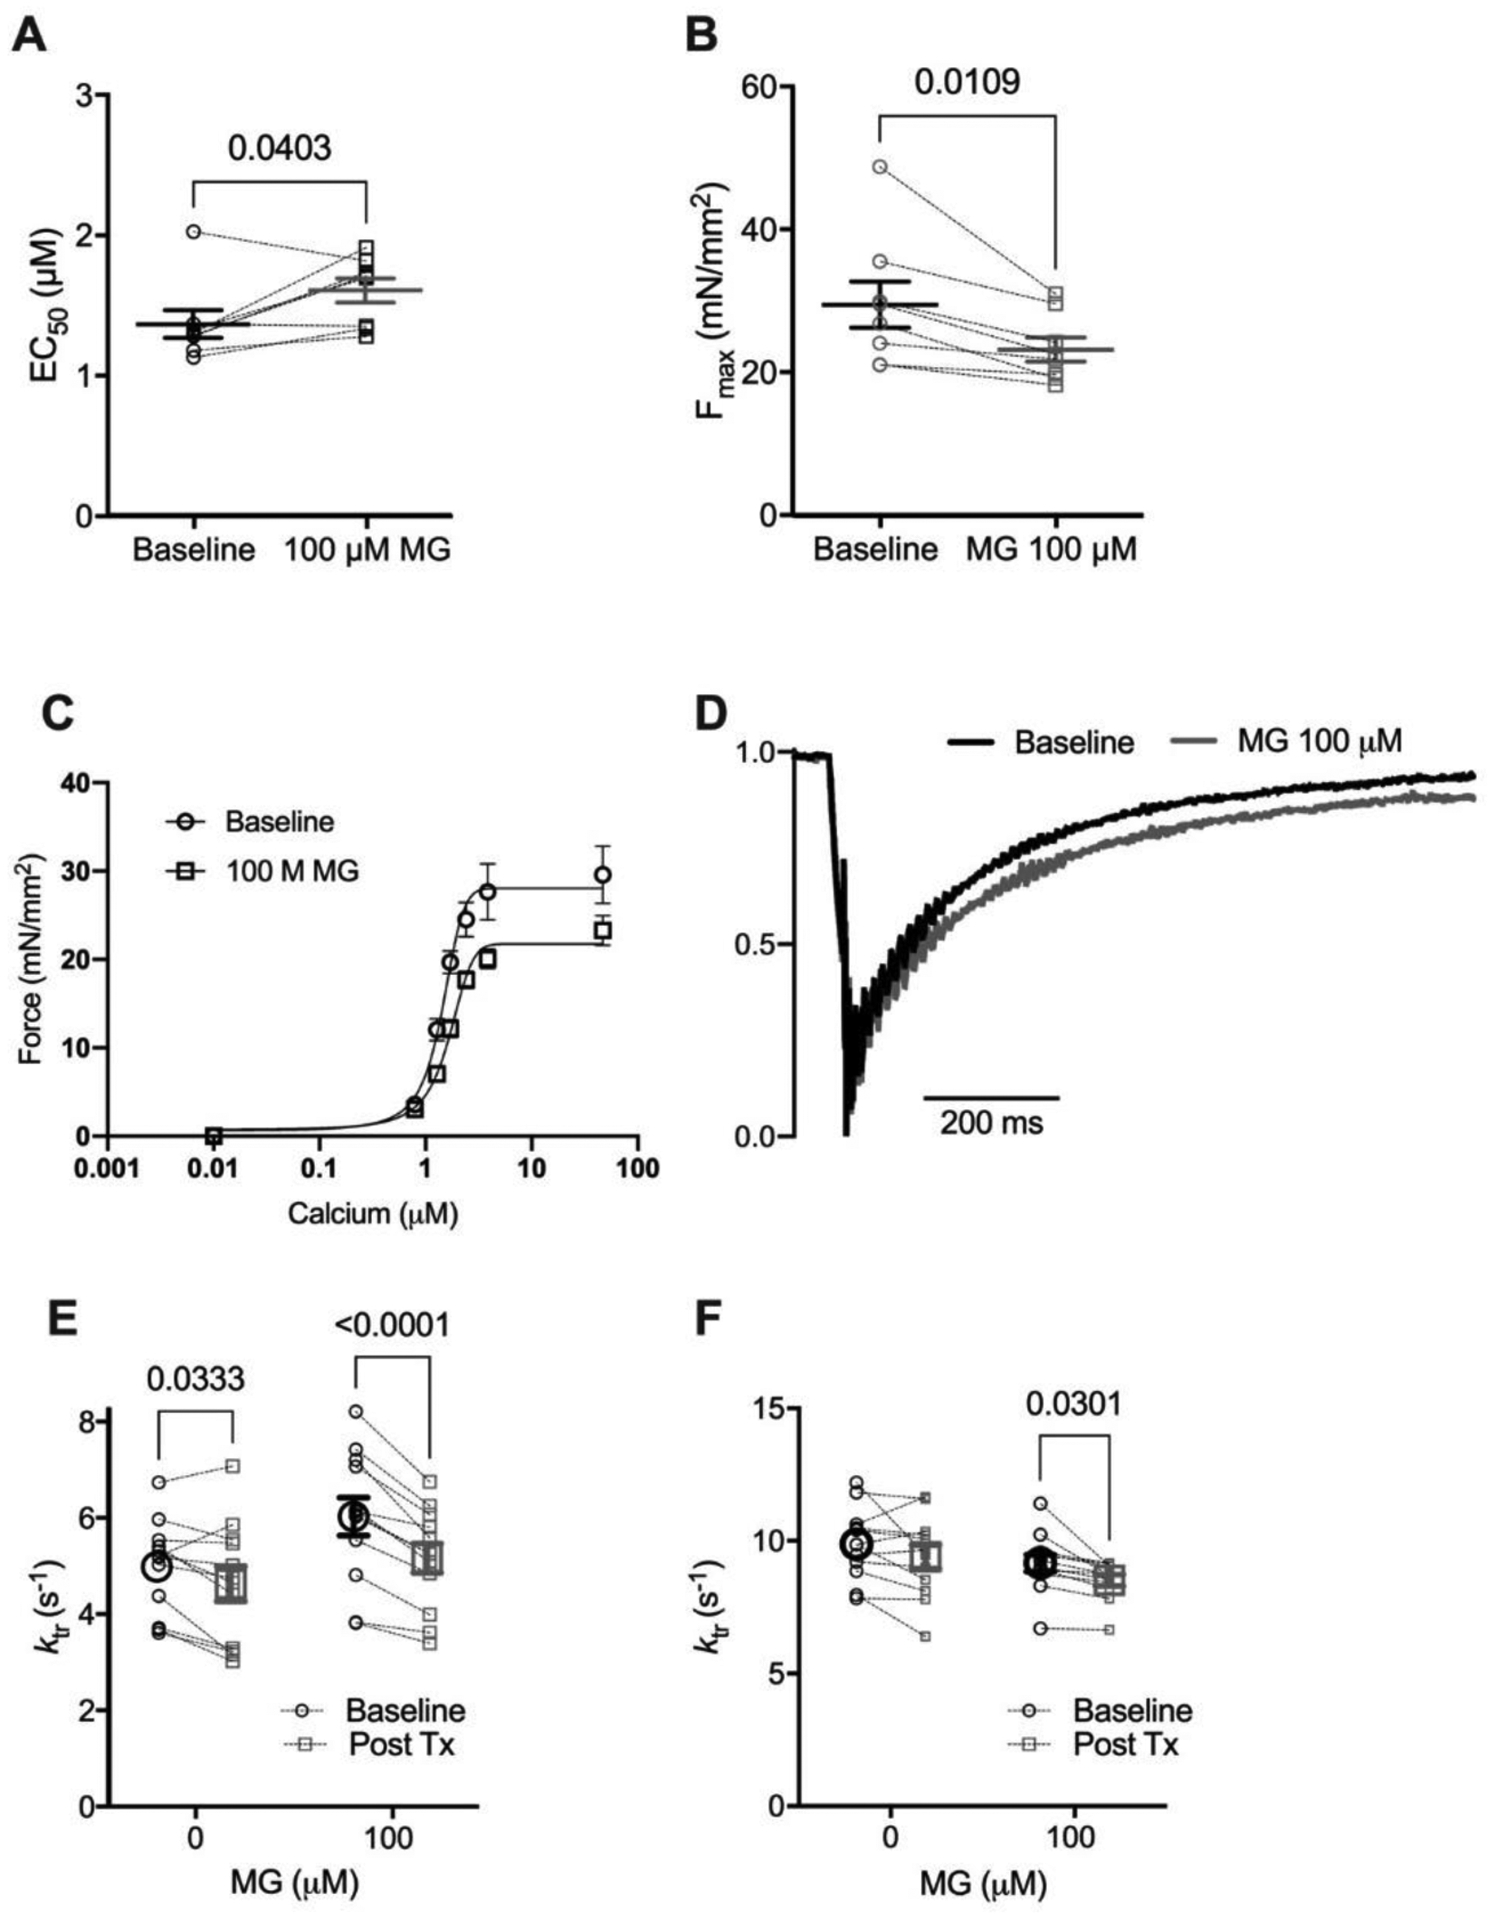
Figure 2: Methylglyoxal decreases calcium sensitivity, maximal calcium-activated force and rate of force redevelopment (ktr).

(A) Individual and mean ± SEM calculated EC50 (panel A) and Fmax (panel B). (C) Mean force as a function of calcium concentration and fitted curves for mouse skinned myocytes before (circles, solid line) and after (squares, dashed line) exposure to 100 μM Methylglyoxal (MG). (D) Normalized ktr curve before (black) and after (grey) treatment with 100 μM MG at submaximal Ca2+ concentration (average from 12 cells). (E) Individual and mean ± SEM calculated ktr values before (Baseline, black circles) or after (Post Tx, grey squares) treatment with 0 (no treatment) or 100 μM MG at sub-maximal Ca2+ concentration (n=12 myocytes from 4 mice, pinteraction = 0.016) (Mean ± SEM). (F) ktr before (black circles) or after (grey squares) treatment with 0 or 100 μM MG at maximal Ca2+ concentration (n=12 myocytes from 4 mice, pinteraction = n.s.). Statistical comparisons made with 2-way repeated measures ANOVA with Sidak post-hoc test.
