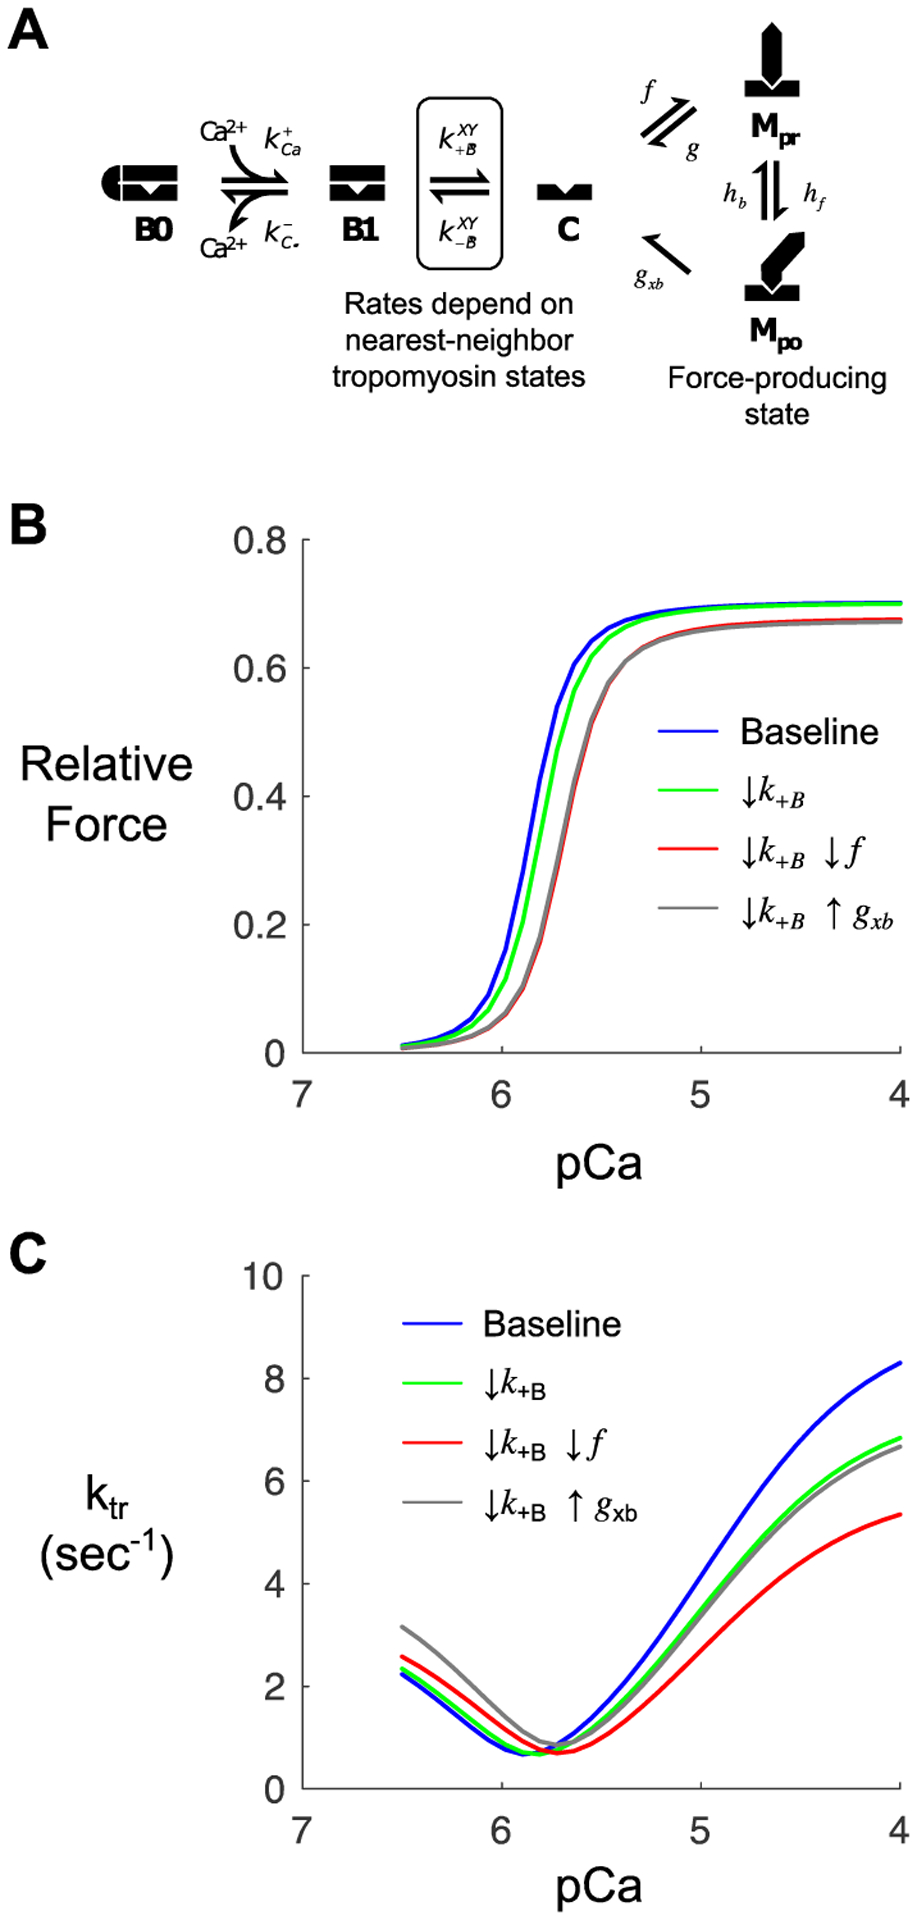
Figure 3: Computer modelling to identify potential methylglyoxal molecular effects.

(A) Kinetic scheme for a previously published model of myofilament Ca2+ activation [24]. The model depicts states of thin filament regulatory units (B0, blocked and Ca2+-free; B1, blocked and Ca2+-bound; C, closed) and cycling of associated myosin crossbridges (Mpr, myosin pre-powerstroke; Mpo, myosin post-powerstroke). (B) Steady-state force-pCa curves produced by the model under baseline (control) conditions and various perturbations intended to qualitatively mimic observed effects of MG. Simulations show the anticipated effects of slowing the blocked-closed transition of tropomyosin (k+B) on its own (green) or in combination with slowing myosin attachment (f, red) or myosin detachment (g, gray). (C) Model-predicted ktr-pCa relationships corresponding to the same conditions as in panel B.
