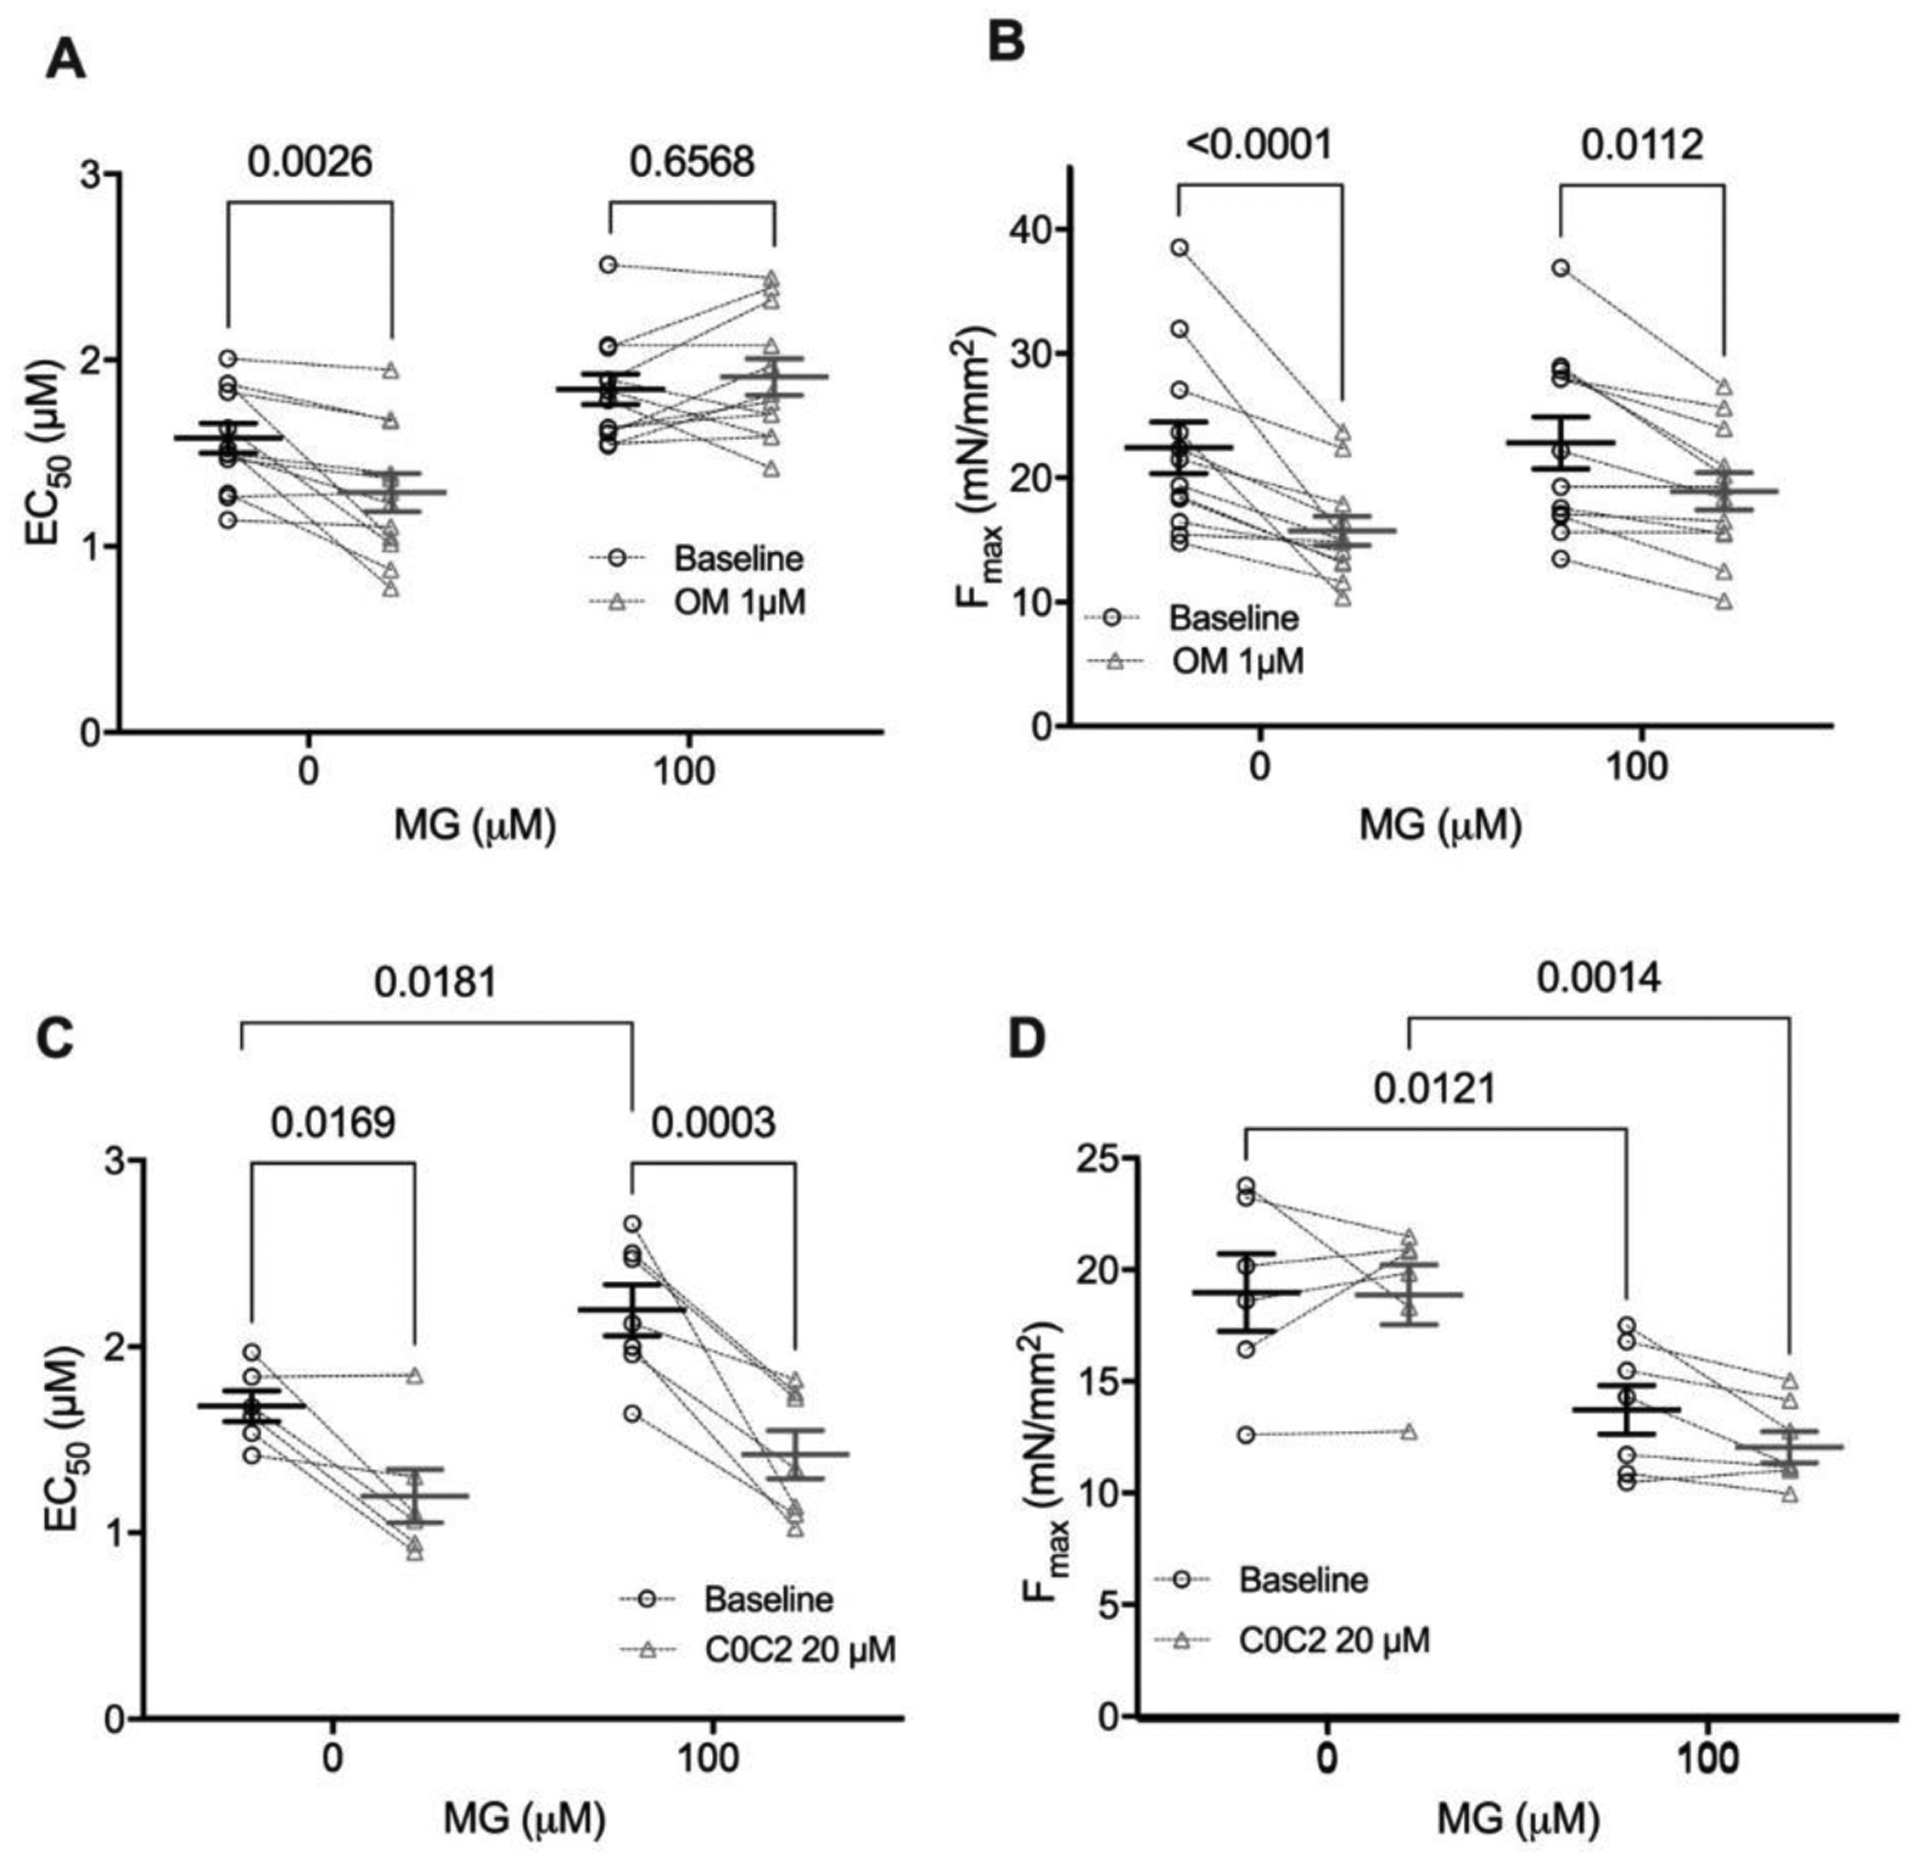
Figure 6: C0C2 rescues the calcium sensitivity decrease caused by MG in skinned cardiomyocytes but OM does not.

(A) Individual and mean ± SEM EC50 values from skinned myocytes pre-exposed to 0 μM MG (n=6) or 100 μM MG (n=7 from 3–4 mice) before treatment with omecamtiv mecarbil (baseline, black circles) or after (OM 1 μM, grey triangles). Paired before and after data for an individual cell are connected by dashed lines. (B) Individual and mean ± SEM Fmax values from skinned myocytes pre-exposed with 0 μM MG (n=4) or 100 μM MG (n=7 from 3 mice) before OM (baseline, black circles) or after (OM 1 μM, grey triangles). Individual and mean ± SEM calculated EC50 (panel C) and Fmax (panel D) from skinned myocytes pre-exposed to 0 μM MG (n=8) or 100 μM MG (n=12 from 4 mice) before (baseline, black circles) or after treatment with 20 μM cardiac myosin binding protein C C0C2 peptide (20 μM C0C2, grey triangles) (n=12 myocytes from 4 mice). Paired before and after treatment data for each individual cell are connected by dashed lines. Statistical comparisons by two-way repeated measures ANOVA with Sidak post-hoc test.
