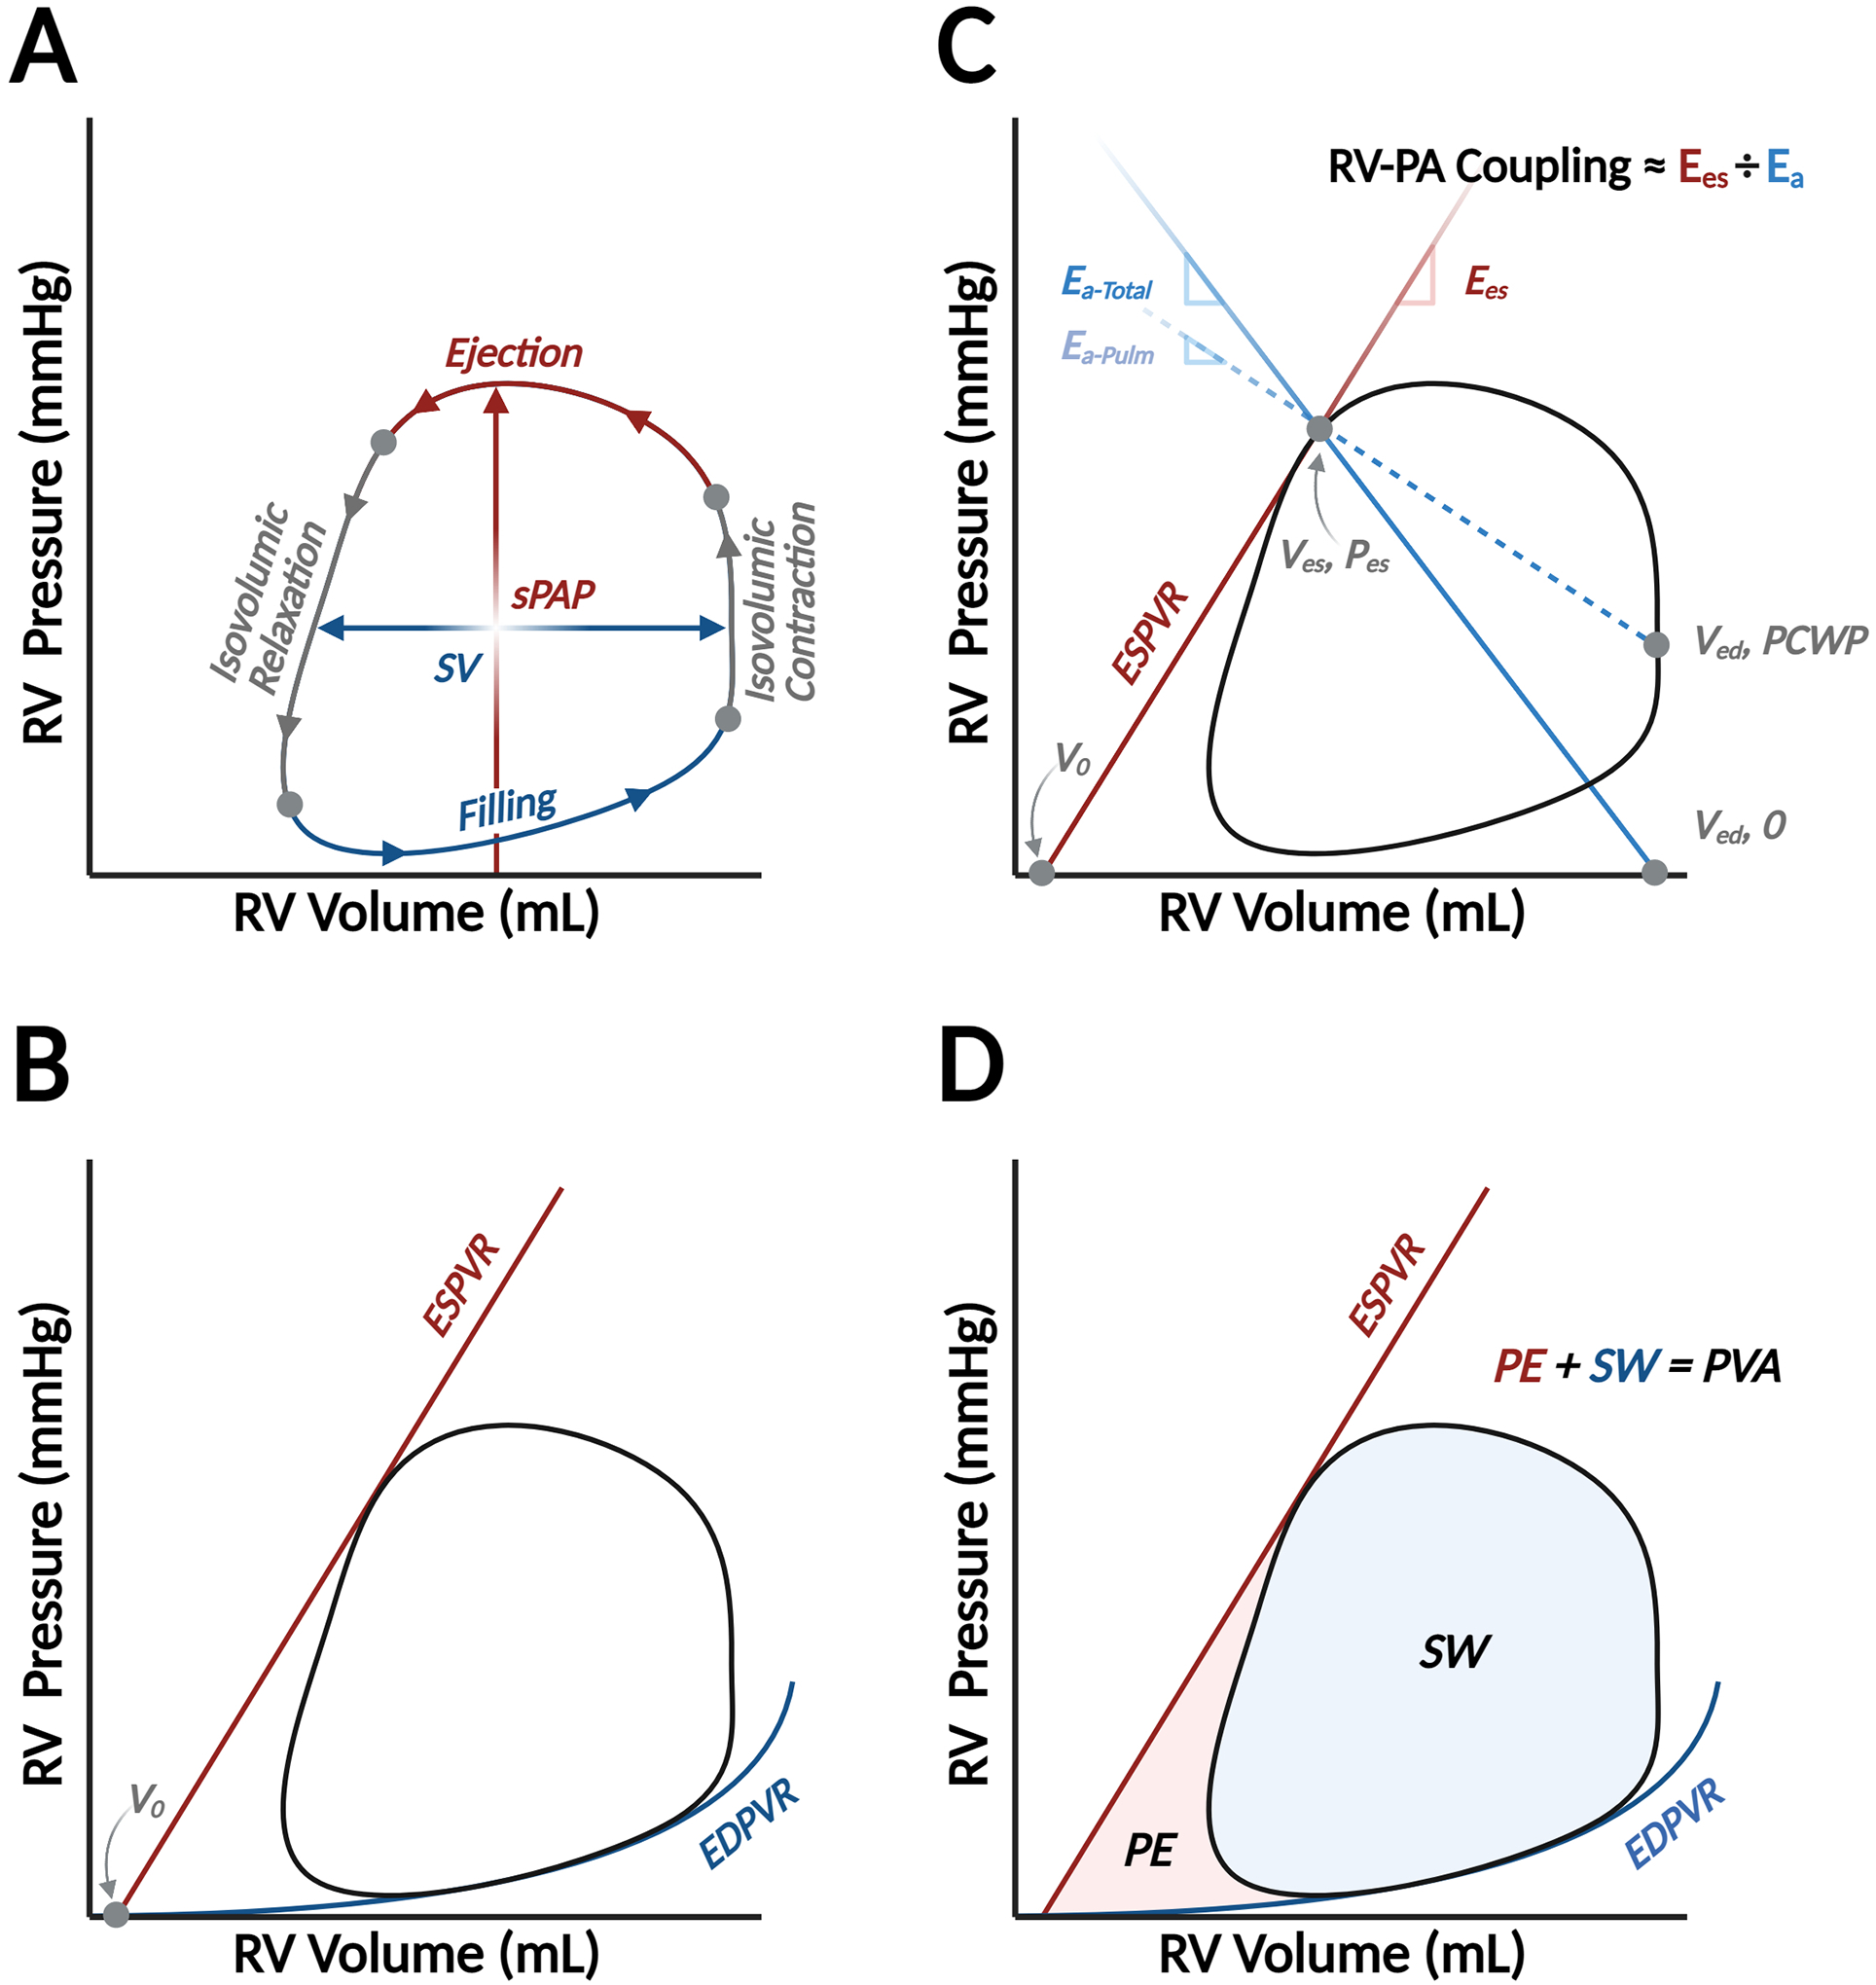
Figure 1. Basic elements of the right ventricular pressure-volume diagram.

The pressure-volume (PV) diagram summarizes hemodynamic changes during one cardiac cycle, which is divided into four phases: ventricular filling, isovolumic contraction, ejection, and isovolumic relaxation (Panel A). The width of the loop represents ventricular stroke volume (SV), and the peak pressure is right ventricular or pulmonary artery systolic pressure (sPAP). Two fundamental relationships create boundaries for the PV loop: the end-systolic PV relationship, which describes ventricular contractile properties, and the end-diastolic PV relationship (EDPVR), which describes ventricular diastolic function (Panel B). ESPVR is reasonably linear and connects the end-systolic PV coordinate with the volume-axis intercept (V0), or the unstressed blood volume of the ventricle. The PV loop is also a valuable platform to relate vascular properties. Afterload can be characterized by effective arterial elastance, which is a lumped parameter (Ea-Total) reflecting the influence of downstream pressure (i.e., pulmonary capillary wedge pressure, PCWP) and intrinsic properties of the pulmonary vasculature (Ea-Pulm). Ea-Pulm is reflected by the slope of the line connecting the end-systolic PV coordinate with (Ved, PCWP), while Ea-Total connects the end-systolic coordinates and the volume-axis intercept at end-diastolic volume (Ved, 0).2 Relating systolic function, summarized by the slope of ESPVR (also known as end-systolic elastance, Ees), to Ea is the foundation of a concept called right ventricular (RV)-pulmonary arterial (PA) coupling (Panel C). Finally, myocardial energetics can also be inferred from the PV diagram. The space within the loop is stroke work (SW) and the potential space bound within the ESPVR and EDPVR but outside the loop is the potential energy (PE). The sum of SW and PE is PV area (PVA), which is linearly related to myocardial oxygen consumption (Panel D).
