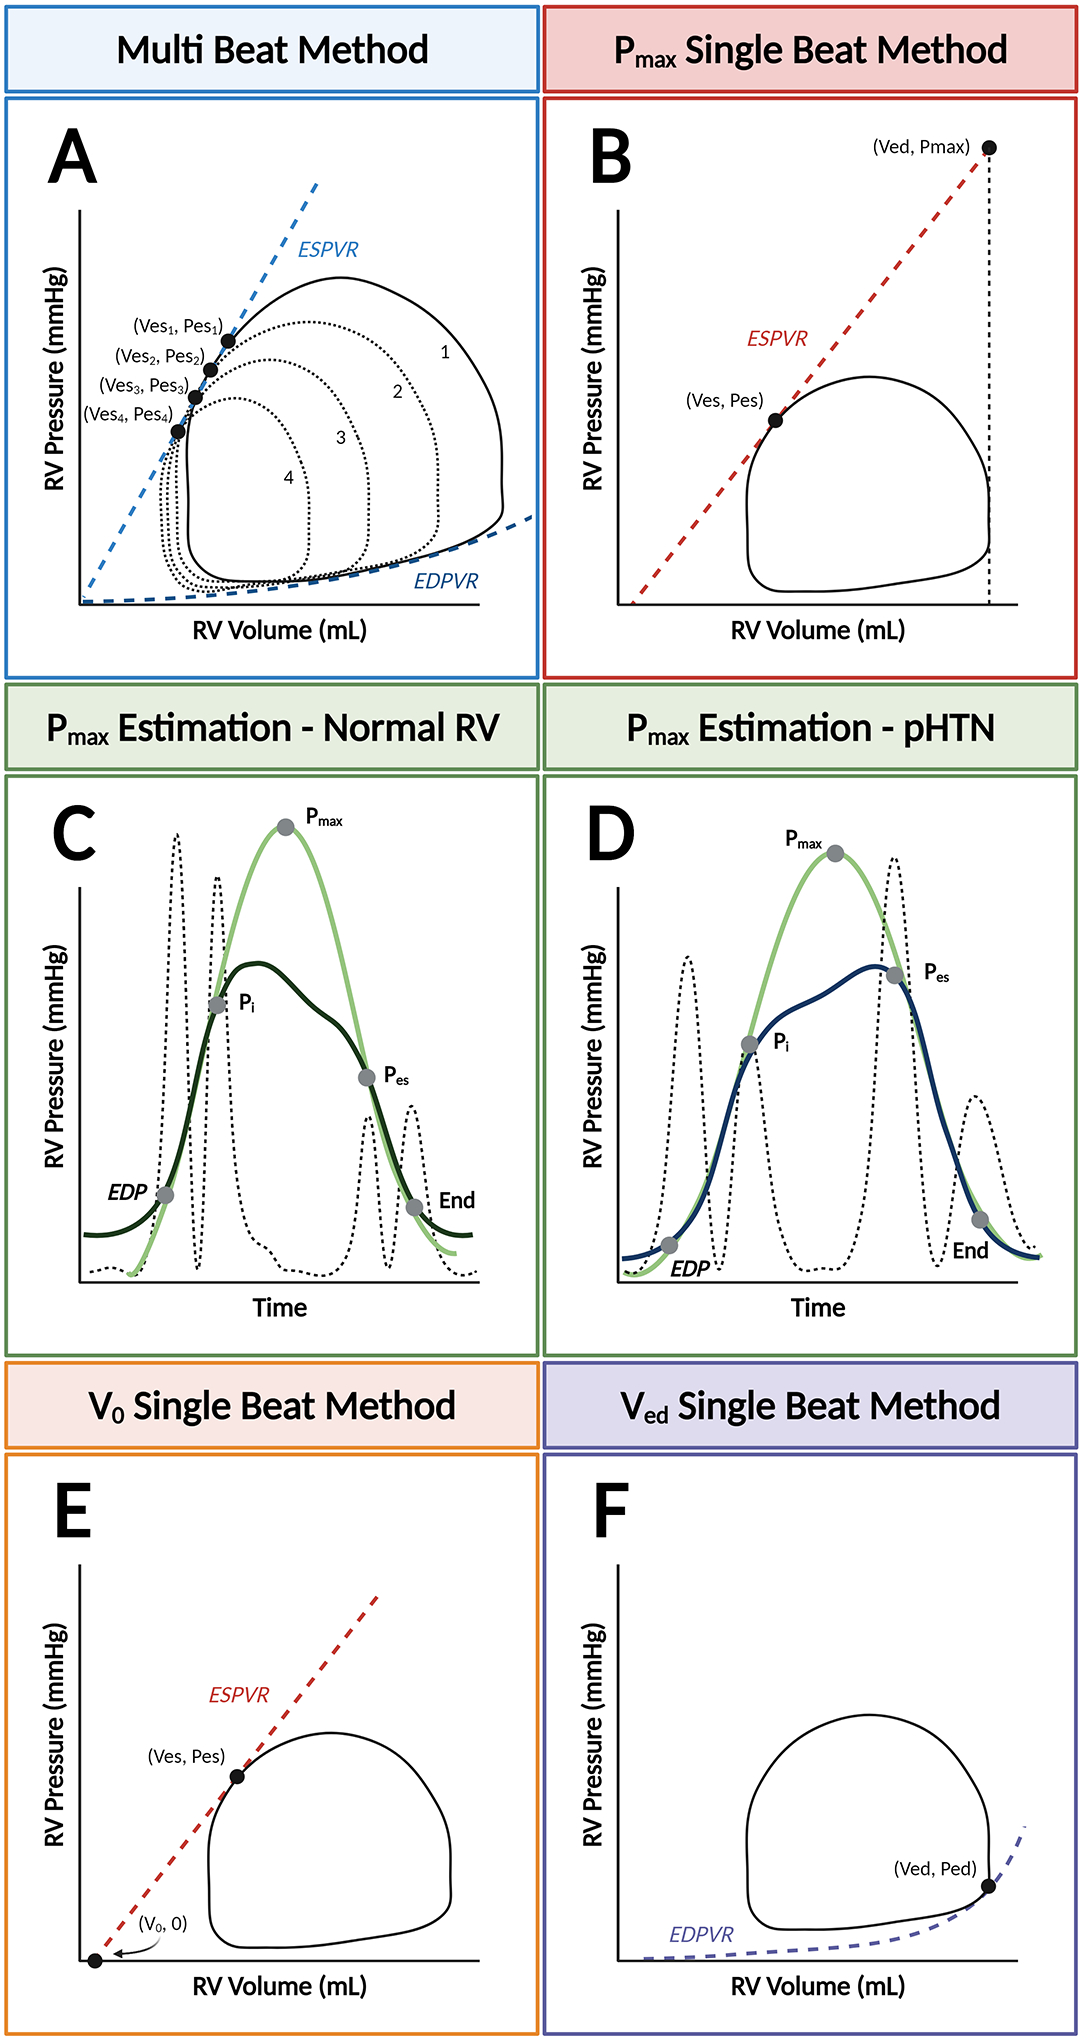
Figure 3. Multi- and single-beat methods and notable limitations for estimating end-systolic pressure-volume relationships.

The end-systolic pressure-volume relationship (ESPVR) can be modeled with two different methods: the multi-beat method (Panel A), which plots ESPVR by connecting serial end-systolic PV coordinates, or the single-beat method, which extrapolates either the maximal isovolumic pressure (Pmax) (Panel B) or the volume-axis intercept (V0). Pmax is represented by the peak of a curve fitted to discrete points during the cardiac cycle from the right ventricular (RV) pressure waveform. Determination of these timepoints can be standardized by taking the second derivative of RV pressure squared (hatched line). With this method, the “up interval” for Pmax prediction extends from end-diastolic pressure (EDP) to the first major inflection point (Pi), and the “down interval” from Pes to the estimated end of isovolumic relaxation. This method is validated in patients with normal RV pressures (Panel C) and pulmonary hypertension (Panel D). Alternatively, determination of Vo can be used with the single-beat method (Panel E). Finally, the single-beat method for determining the end-diastolic PV relationship (EDPVR) relies on of the end-diastolic coordinate (Ved, Ped) (Panel F).
