Fig. 3.
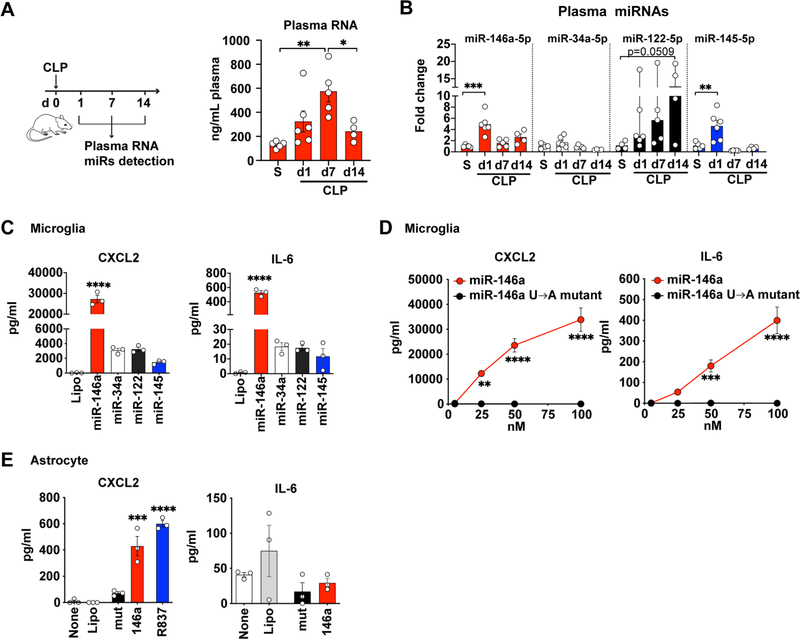
miRNA mimics induce cytokine production in both cultured microglia and astrocytes. (A) A schematic diagram of plasma collections following CLP and plasma RNA concentration at day 1, 7, 14. S = sham. n = 4–6/group. *p = 0.0398, **p = 0.0026, one-way ANOVA with Bonferroni post hoc test. (B) Relative expression of plasma miR-146a-5p, miR-34a-5p, miR-122–5p and miR-145–5p as normalized to spike in cel-miR-39 and expressed as fold change to the sham group (S). n = 4–6/group. Data represent mean ± SEM except miR-122 (Median, 95% CI). **p = 0.0028, ***p = 0.0001, one-way ANOVA with Bonferroni post hoc test and Kruskal-Wallis test for miR-122. (C) CXCL2 and IL-6 in microglia culture media following a 16–18 h treatment with 50 nM of various extracellular miRNAs. The experiments were repeated twice with triplicates. ****p < 0.0001, CXCL2: F(4,10) = 188.9, IL-6: F(4,10) = 326.5, one-way ANOVA with Bonferroni post hoc test. (D) miR-146a but not its U → A mutant dose-dependently induced CXCL2 and IL-6 production in cultured microglia. The experiments were repeated twice with triplicates. ***p = 0.0005, ****p < 0.001, two-way ANOVA with Bonferroni post hoc test. (E) CXCL2 and IL-6 following a 16–18 h treatment with miR-146a (50 nM), U → A mutant (mut, 50 nM), and R837 (TLR7 ligand, 1 μg/ml) in cultured astrocytes. The experiments were repeated twice with triplicates. ***p = 0.001, ****p < 0.0001, one-way ANOVA with Bonferroni post hoc test.

