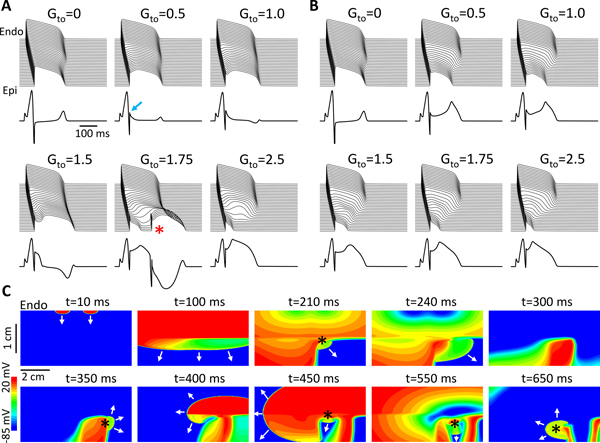
Figure 1. Effects of late Ito on ST-segment properties and P2R.
Simulations were carried out in a 2D tissue model with an endocardial-to-epicardial Ito gradient. A. Time-space plots of V and ECGs for different levels of Gto (in unit mS/cm2) when γ = 0. The arrow in the 2nd panel points to the elevated J-point. The asterisk in the 5th panel indicates the P2R/PVC. B. Same as A but when γ = 0.1. C. Wave dynamics in the same 2D tissue as for A but with an Ito heterogeneity in the longitudinal direction. Shown are voltage snapshots at different time points. Arrows indicate propagating wavefronts. A wave elicited from two stimulus sites (t=10 ms) propagated from the endocardium to epicardium (t=100 ms). Due to the early repolarization in the lower-right quadrant, a P2R occurred (t=210 ms, marked by *), propagated toward the tissue boundary (t=240 ms) and disappeared. The repolarization pattern remained heterogeneous (t=300 ms) and a new P2R occurred (t=350 ms) that propagated as a spiral wave reentry (t=400 ms) before wandering off the tissue boundary (t=450 ms). New P2Rs (*) also occurred in snapshots at t=450, 550, and 650 ms. Due to the tissue size, the last P2R shown in t=650 ms was not able to survive, and the tissue became quiescent before the next pacing beat. See Movie I in Data Supplement for the detailed wave dynamics. Tissue size was 7.68 cm × 1.92 cm.

