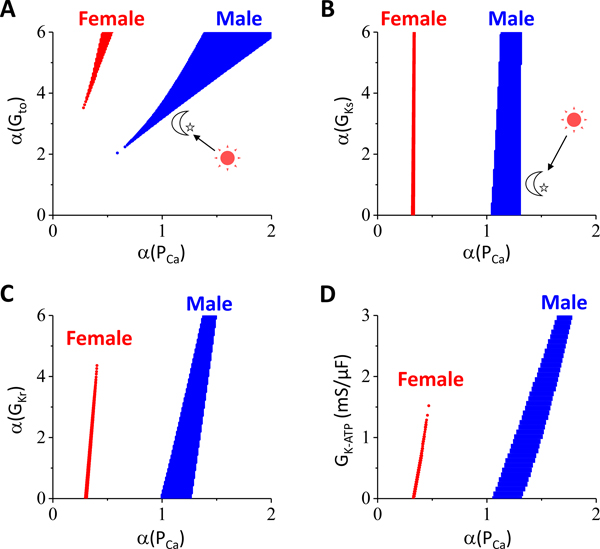
Figure 8. Effects of sex difference and circadian rhythm on P2R.
Simulations were done in the 1D cable as for Fig.2 except that the maximum conductances of ionic currents were different for female and male. The control parameters for male were the same as for Fig.2. The female-to-male ratios of the maximum conductance were shown in Table I in Data Supplement. α is the fold change of the maximum conductance from the control values. For example, α(PCa) implies the PCa value is α-fold of the control PCa for either female or male. Similar to Fig.6A, the “Spike & Dome” region is in the right and the “Spike” region is in left of the P2R region for all the panels in this figure. A. P2R regions for male and female versus α(PCa) and α(Gto). B. P2R regions for male and female versus α(PCa) and α(GKs). C. P2R regions for male and female versus α(PCa) and α(GKr). D. P2R regions for male and female versus α(PCa) and GK-ATP. Since there was no IK-ATP in control, GK-ATP instead of α(GK-ATP) was used in this panel. α(Gto)=4 was used for B-D. Note that the P2R region in D is more tilted to the right than those in B and C, indicating that IK-ATP exhibits a larger effect in changing the ICa,L threshold for P2R and thus a larger effect on promoting P2R. In the ten Tusscher human model, we observed an even more tilted P2R region which also expanded as GK-ATP increased (see Fig.XD in Data Supplement).

