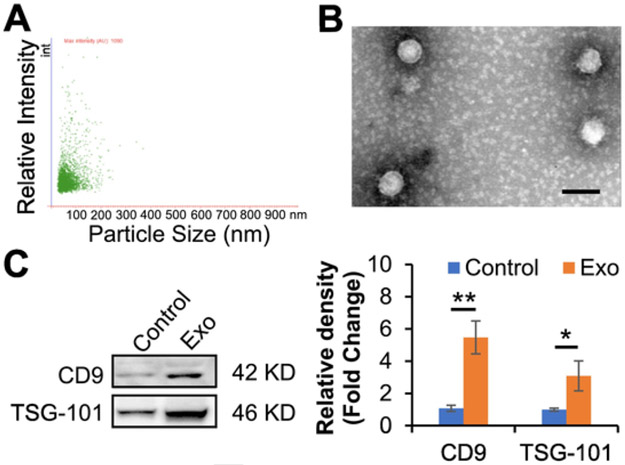
Fig. 1.
Characterization of exosomes from ASCs. A, The isolated exosomes were examined using nanoparticle tracking analysis. Scatter plot graphs of exosomes demonstrated the particle size versus light intensity of exosomes. B, Morphology of exosomes was visualized under transmission electron microscopy (scar bar: 100 nm). C, Exosomal markers, CD9 and TSG101, in exosomes from ASCs with endothelial differentiation medium preconditioning (Exo) were determined via immunoblotting analysis. Exosomes from ASCs without preconditioning were used as a control. Each lane represented an exosomal lysate collected from 1 × 10⁶ ASCs. The right panel is a statistical analysis of the density of the immunoblotting bands using Image J software (n = 6 independent experiments). Protein levels of the control were set to 1. Data shown were evaluated with a two-tailed Student's t-test and presented as the mean ± SD. *p < 0.05, **p < 0.01.

