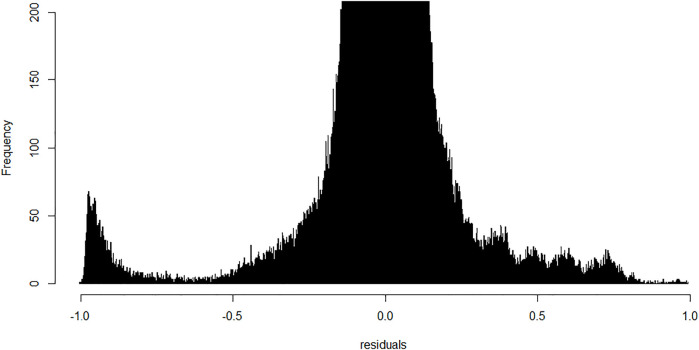
FIGURE 6.
Frequency of probes generated residuals after application of the fitted linear model; bin width is 0.001. Y-range is limited from 0–200 to allow visualization of important minority groups. Most of the probes centered around zero with a small peak in the furthest negative region indicative of a cluster of probes methylated in polymorphonuclears and lymphocytes but not in the original buffy coat.

