FIGURE 2.
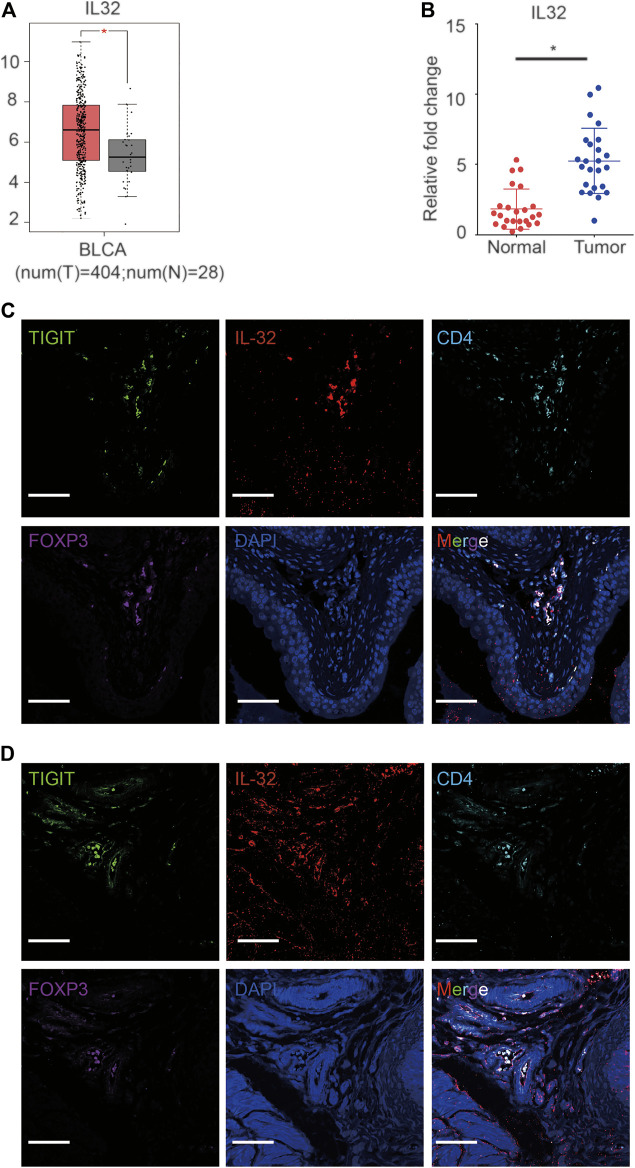
Expression of IL-32 in Treg cells in bladder cancer tissues. (A) Higher expression of IL-32 in the bladder cancer cohort in the TCGA and GTEx databases. Data are shown as the mean ± standard deviation (SD). *p < 0.05; t-test. (B) Higher relative expression of IL-32 in bladder cancer tissues. qRT-PCR analysis showing the relative expression of IL-32 in healthy and cancerous bladder tissues. Data are shown as the mean ± SD. *p < 0.05; t-test. (C) IL-32 colocalizes with Treg cells in human bladder cancer tissues. Representative immunofluorescence images showing cells stained with anti-FOXP3 (violet), IL-32 (red), CD4 (light blue), TIGIT (green), and DAPI (blue). Scale bar = 100 μm.(D) IL-32 colocalizes with Treg cells in murine bladder cancer tissues. Representative immunofluorescence images showing cells stained with anti-FOXP3 (violet), IL-32 (red), CD4 (light blue), TIGIT (green), and DAPI (blue). Scale bar = 100 μm.

