
Figure 2.
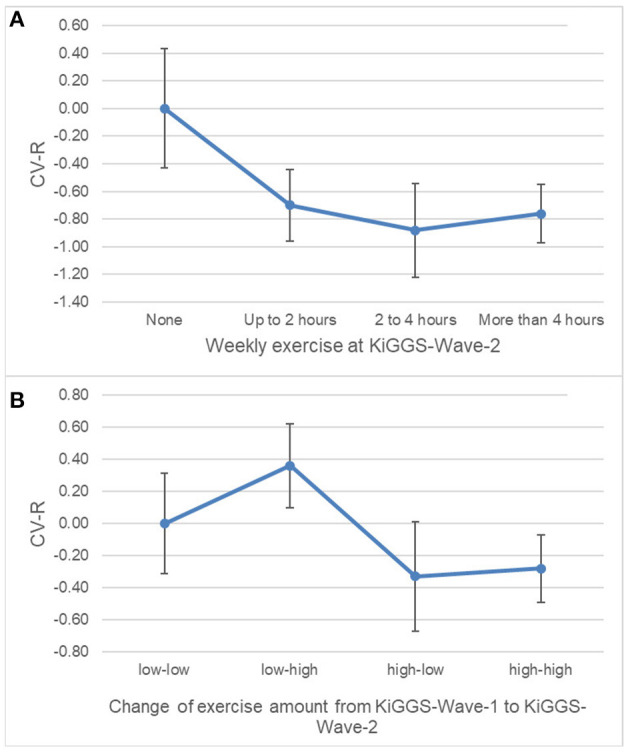
Margin plots demonstrating associations of the cardiovascular risk index (CV-R) with cross-sectional (A) and longitudinal (B) volumes of exercise. CV-R is significantly lower with higher cross-sectional and longitudinal volumes of exercise. “None” set as reference. Weighted estimations from linear regression; n = 2,893. Vertical bars = 95%–confidence intervals. Models adjusted for sex and age.