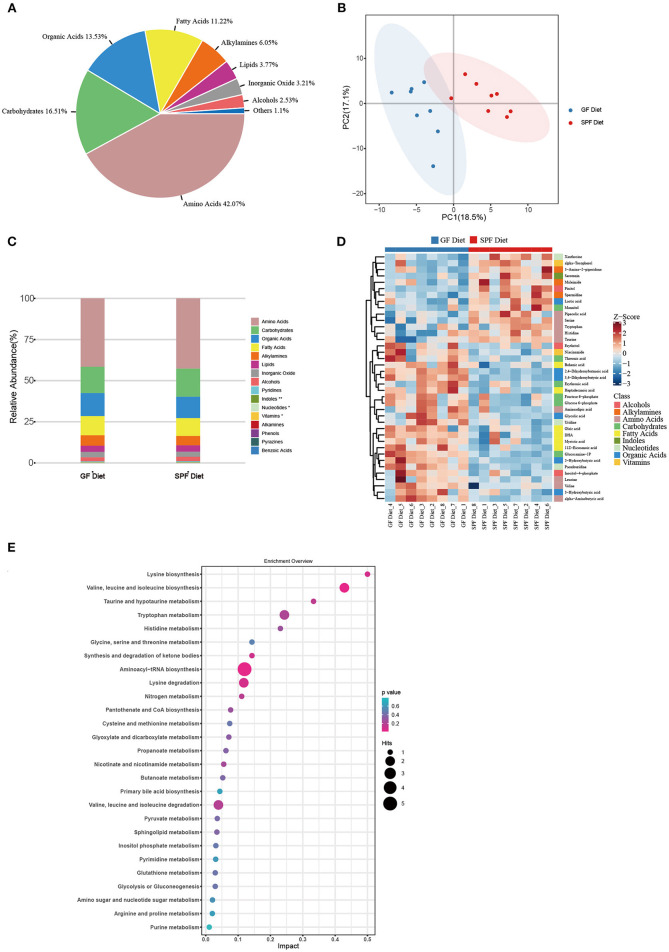
Figure 5.
Effect of GF diet on metabolic profiles of serum in SPF mice. (A) Distribution of metabolite classes. (B) Principal component analysis (PCA) score plot of all samples. (C) Distribution of the relative abundance of metabolites of each Class in different groups. (D) Heatmap of the potential biomarkers. The relative abundance values of metabolites in different samples are depicted by color intensity. (E) Pathway analysis bubble plot. The horizontal coordinate is the extent to which the pathway is affected, and the number of differential metabolites in the pathway is represented by graphs of different sizes. The P-values calculated by the enrichment analysis are described in terms of color intensity.

