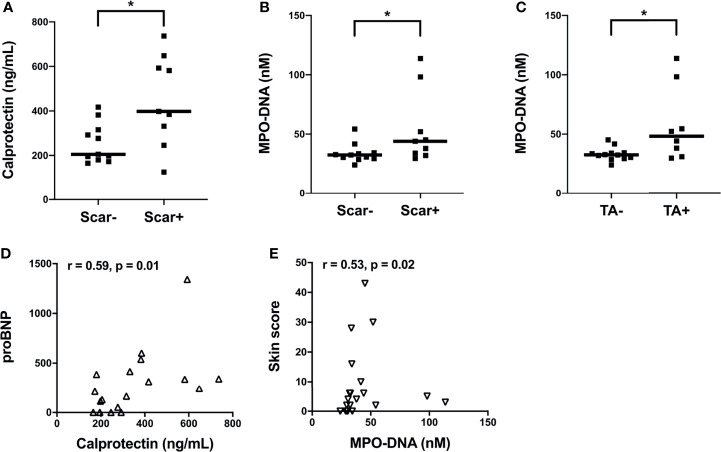
Figure 2.
Associations of plasma levels of neutrophil activation markers with clinical parameters in SSc patients from Cohort II. (A) Plasma calprotectin levels in the presence and absence of scar tissue manifestation in SSc patients. Plasma NET (myeloperoxidase-DNA complexes) levels in the presence and absence of (B) scar tissue manifestation and (C) telangiectasia (TA) condition in SSc patients. (A-C) Cohort II: SSc2, Black square (▪). Shown are the correlation analysis between (D) calprotectin levels and brain natriuretic peptide (proBNP) (Δ) and (E) NET (myeloperoxidase-DNA complexes) levels and Skin score (∇) in SSc patients. Each symbol represents a single subject. Bars represent the median and statistics were determined by (A-C) Mann-Whitney U test with *p<0.05 and (D, E) Spearman’s correlation test.

