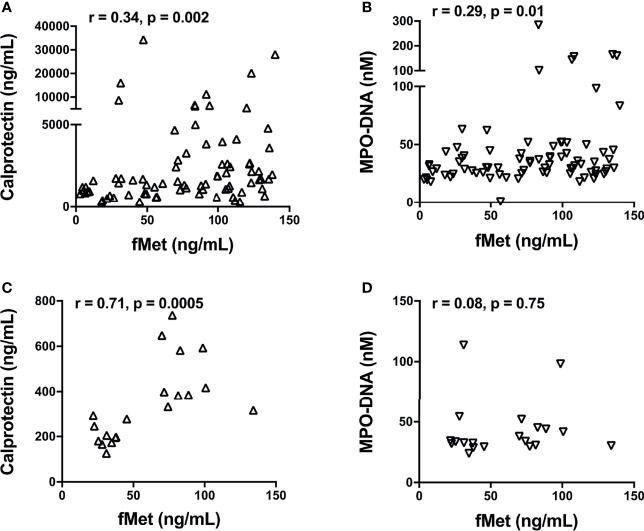
Figure 4.
Levels of fMet in SSc patients associate with neutrophil activation markers. Levels of fMet, calprotectin, and NETs (myeloperoxidase-DNA complexes) were analyzed by ELISA. Shown are the correlation analyses between (A) calprotectin (Δ) and (B) NETs (∇) with fMet levels in SSc patients from Cohort I. (C) Calprotectin (Δ) and (D) NETs (∇) correlation with fMet levels is shown in SSc patients from Cohort II. Each symbol represents a single subject. Statistics were determined by Spearman’s correlation test.

