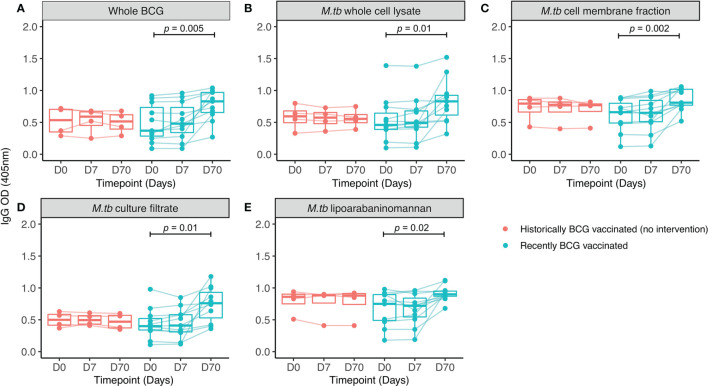
Figure 2.
IgG responses to different mycobacterial fractions in serum collected from Nepalese military recruits. Serum samples were taken from Nepalese adults enrolled into human Study 2 (red = historically BCG-vaccinated individuals who received no intervention, cyan = BCG-naïve individuals who received BCG vaccination). IgG responses to whole BCG (A), M.tb whole cell lysate (B), M.tb cell membrane fraction (C), M.tb culture filtrate (D) or M.tb lipoarabaninomannan (E) were measured. Points represent the mean of triplicate values, boxes indicate the median value with the interquartile range (IQR) and the upper whisker extends to the largest value no further than 1.5 * IQR from the hinge, the lower whisker extends from the hinge to the smallest value at most 1.5 * IQR from the hinge. Outliers are plotted individually. A repeated measures one-way ANOVA with Dunnett’s multiple comparisons test was used to compare between time-points in the BCG vaccinated group.

