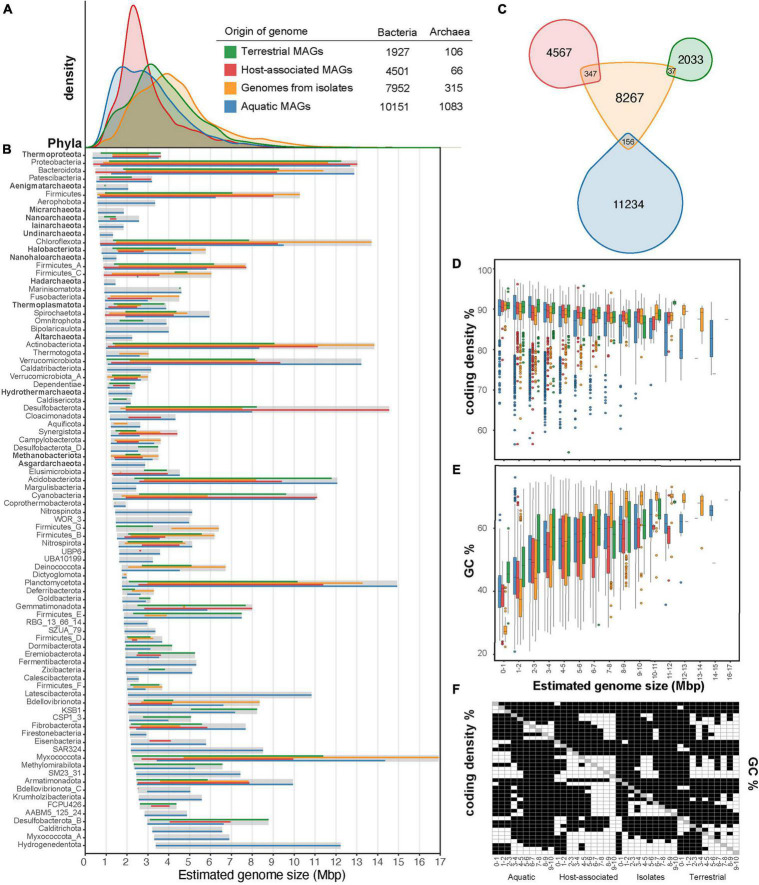
FIGURE 1.
Overview of the genome size distribution across Earth’s microbiomes. Genome size distribution of Archaea and Bacteria (A) from different environmental sources and across different archaeal and bacterial phyla (B) are shown for a total of 26,101 representative genomes. Isolate genomes were gathered from GTDB (release95) and environmental MAGs were gathered from GEMs (Nayfach et al., 2020) and stratfreshDB (Buck et al., 2021a). We use one representative genome per mOTU (defined by 95% ANI) from the union of GEMs catalog and stratfreshDB in the plots. From the GTDB database, we selected one representative isolate genome per species cluster that was circumscribed based on the ANI (≥95%) and alignment fraction [(AF) > 65%] between genomes (Parks et al., 2020). To construct the figures, we plotted the min-max estimated genome sizes, which were calculated based on the genome assembly size and completeness estimation provided. Venn diagram of the intersection between the representative environmental MAGs and the representative isolate genomes (C). The intersection was calculated using FastANI (Jain et al., 2018) and was determined with a threshold of 95%. The coding density (D) and GC content (%) (E) are shown for the archaeal and bacterial MAGs across different ecosystem categories and isolates. Pair-wise t-test was performed in all variables of (D,E) and shown in (F), where white is significant (p < 0.05) and black is not significant (p > 0.05). In (B), we only included phyla with more than five genomes.

