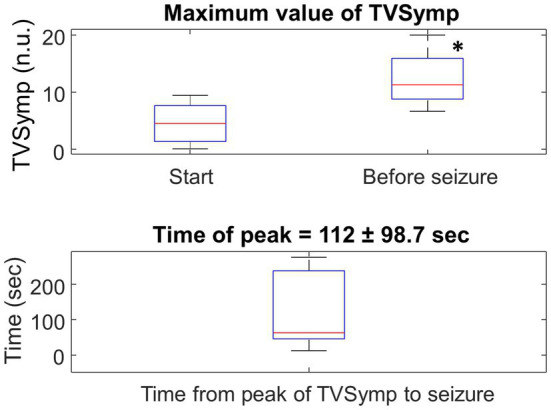
Figure 11.

Top: Boxplot for the maximum value of TVSymp at the Start (chamber pressurized) and Before seizure for the entire population. N = 10, * represents significance difference to Start of HBO2 (p = 0.005). Bottom: Boxplot of the time-lapse from the peak of TVSymp to the occurrence of the seizure.
