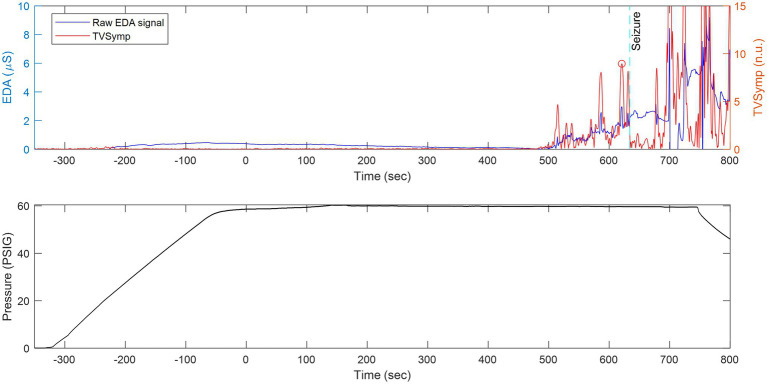
Figure 5.
The same animal as in Figure 8 but with the x-axis compressed in time to show continuously measured raw EDA and its derived TVSymp activity before, during, and after seizure. Top: Raw EDA and time-varying spectral analysis of EDA (TVSymp, non-dimensional units) for a rat undergoing exposure to 5 ATA of HBO2. Bottom: Profile of the dive.

