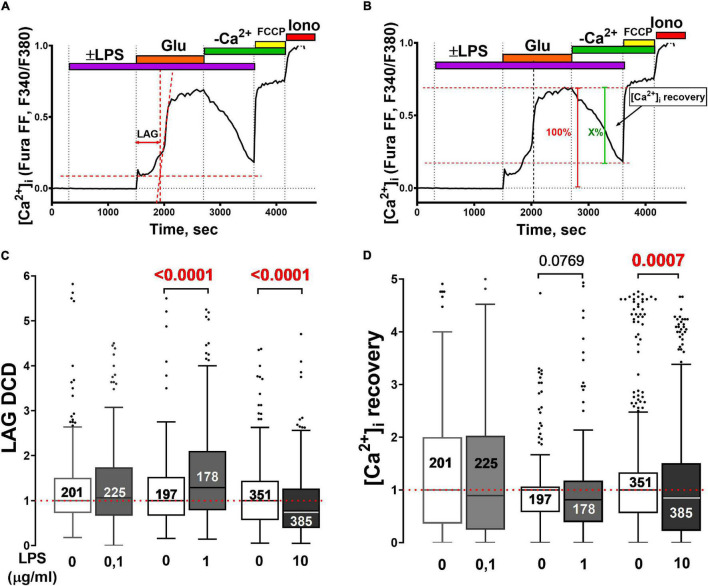
FIGURE 2.
Effect of LPS on the development of glutamate-induced delayed calcium deregulation and post-glutamate [Ca2+]i recovery in neuronal cultures from the rat cortex. (A) Changes in [Ca2+]i in a representative neuron to illustrate the method used to determine the lag-period of delayed calcium deregulation (lag-DCD, s). The onset of DCD is considered to be the intersection of the tangents (red dotted lines) to the [Ca2+]i curve during the first phase of the cellular response to Glu (33 μM) and the secondary rise of [Ca2+]i. The lag-DCD is the time from the Glu addition to the onset of DCD. (B) Illustration of a method for quantifying [Ca2+]i recovery (X,%) after Glu washout. (C) Turkey box-plot histogram of lag-DCD (s) during Glu challenge and (D) [Ca2+]i recovery (X,%) during Glu washout in the presence of different LPS concentrations. Numbers on histogram bars indicate the amount of neurons that developed DCD; 5–8 experiments for each LPS concentration and control experiments in sister cultures. LPS concentrations (μg/ml) are given beneath the bars. Statistically significant differences were determined according to the Mann-Whitney test.

