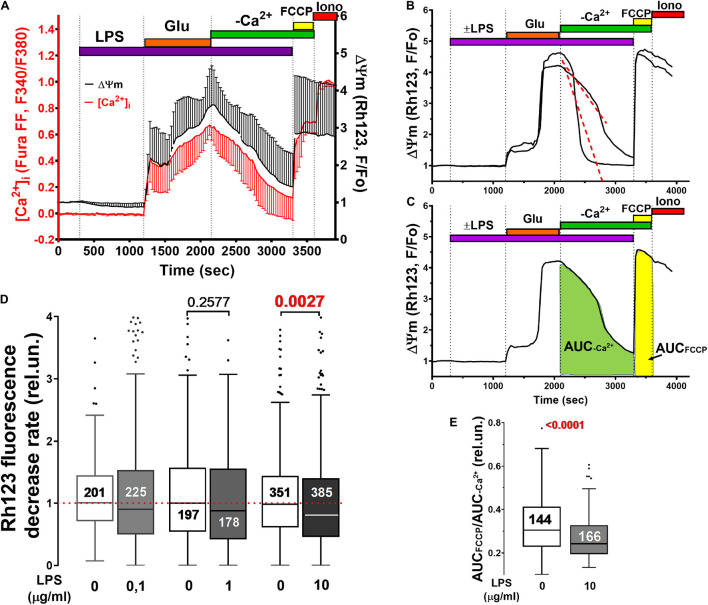
FIGURE 3.
Mitochondrial potential (ΔΨm) changes induced by Glu alone and in the presence of LPS in cultured rat brain cortical neurons. (A) Synchronous changes in ΔΨm and [Ca2+]i measured with a potential sensitive probe Rh123 and calcium indicator Fura-FF, respectively. [Ca2+]i changes are presented as ratio F340/F380 (see legend to Figure 1). Changes in Rh123 fluorescence (excitation: 485 nm; emission: 525 nm) are presented as the ratio F/Fo, where F is the current fluorescence intensity, and Fo is its value at the beginning of the experiment. Curves present Mean ± SD signals of 56 individual neurons. (B,C) Illustrate the methods for quantifying ΔΨm recovery during the post-glutamate period. (D) The rate of ΔΨm recovery was defined as the slope of the decrease in Rh123 fluorescence following Glu washout (see panel B). (E) Degree of ΔΨm recovery in each neuron was determined as the ratio of the area under the curve of Rh123 fluorescence (AUC, rel.un.) observed during protonophore FCCP application to the AUC in the post-glutamate period (AUCFCCP/AUC–Ca2+). Numbers on histogram bars indicate the amount of neurons with DCD. Statistically significant differences were determined according to the Mann-Whitney test. Data represent as Turkey box-plot histograms.

