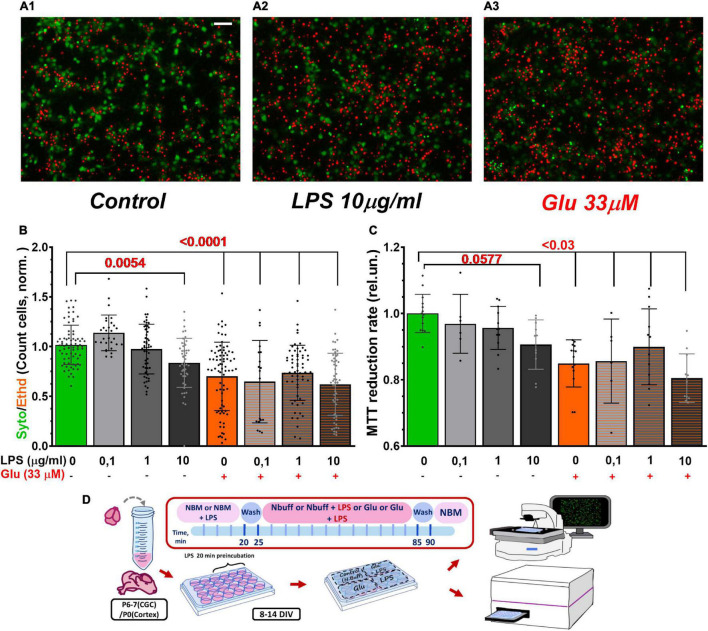
FIGURE 7.
LPS and Glu reduced the survival rate of cultured cerebral neurons evaluated by morphological (A,B) and biochemical (C) approaches. (A) Images of primary neuronal cultures from the rat cortex loaded with the vital fluorescent dyes. Color codes: Syto-13 - green cytoplasm and nucleus of live cells; EthD-1 - red fluorescence of dead cell nucleus. (A1) A typical image of a control culture, (A2) A culture exposed to LPS, and (A3) Culture treated with Glu. LPS and glutamate concentrations are indicated beneath the bars of the histogram. Exposure time of LPS, Glu, and their combined application was 30 min. (B) The ratio of the number of cells that had green Syto-13 fluorescence to the number of cells with red EthD-1 fluorescence normalized to the ratio (Syto/EthD) in control cultures. Each bar was obtained by counting 500–700 cells in 5 non-sister cultures (20–60 images for each group). (C) MTT assay of cell viability. The MTT to formazan reduction rate is the slope of the kinetic light absorption curve at 550 nm (A550) for the first 10 min since MTT addition; absorbance at 650 nm (A650) was considered background and subtracted from A550. The data are normalized relative to kinetics of light absorbance in the control wells. Scale bar in the A1 image corresponds to 50 μm. 3 non-sister cultures (6–14 wells for each group). The data are presented as Means ± SD (One-way ANOVA + Sidak’s multiple comparisons test). Schematic of experimental design for panels A–C (D).

