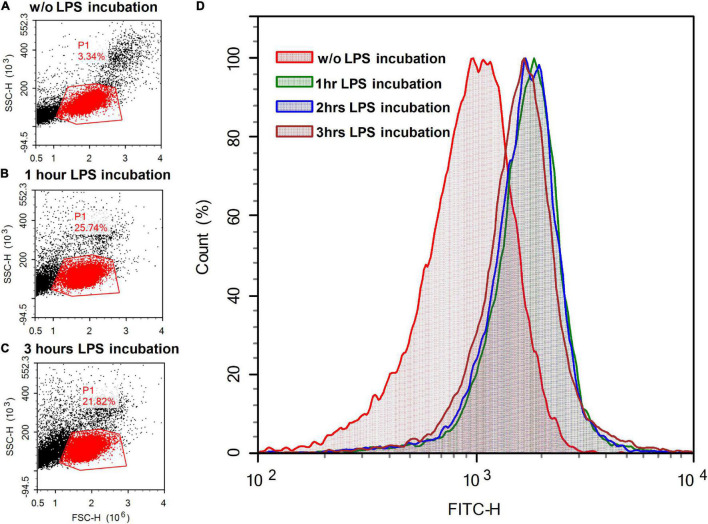
FIGURE 9.
Light scattering (left column of panels) and fluorescent signals (right panel) of lymphocyte suspension (A) without (w/o) the addition of fluorescently labeled LPS analog (BDP-LPS) and after (B) one and (C) 3 h of incubation with BDP-LPS (10 μg/ml). The scattering of laser light (488 nm) in the direction of the beam propagation (FSC-H) and in the perpendicular direction (SSC-H) was recorded for cell selection. Events that had light scattering parameters typical for lymphocytes (gate P1 area) were accumulated (15,000 events) and graphs of the distribution of fluorescent cells were plotted (D) (fluorescence was monitored at 535 ± 15 nm).

