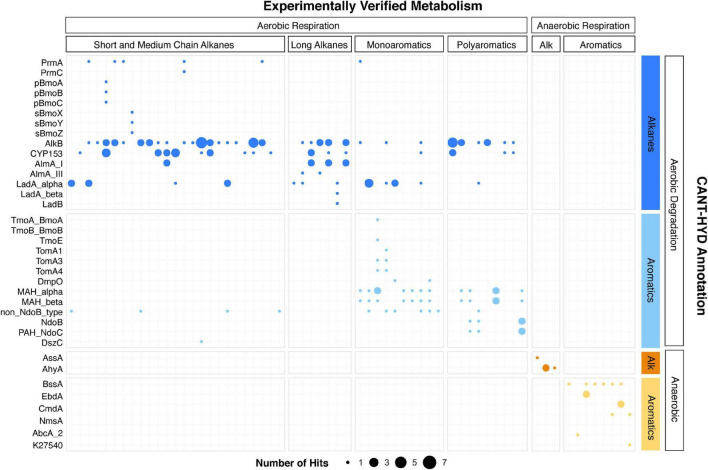
FIGURE 3.
Concordance of CANT-HYD annotations of genomes and their experimentally verified hydrocarbon degradation activity. Each bubble represents hits above the confidence threshold from experientially verified hydrocarbon degrading genomes (x-axis) plotted against the HMMs of the CANT-HYD database (y-axis). The size of the bubble represents number of unique hits in the genome. The genomes (x-axis) and the CANT-HYD HMMs (y-axis) are organized by the hydrocarbon substrate and respiration. A complete list of isolate genomes, their Genbank accession, and their published hydrocarbon degradation capability can be found in Supplementary Table 3.

