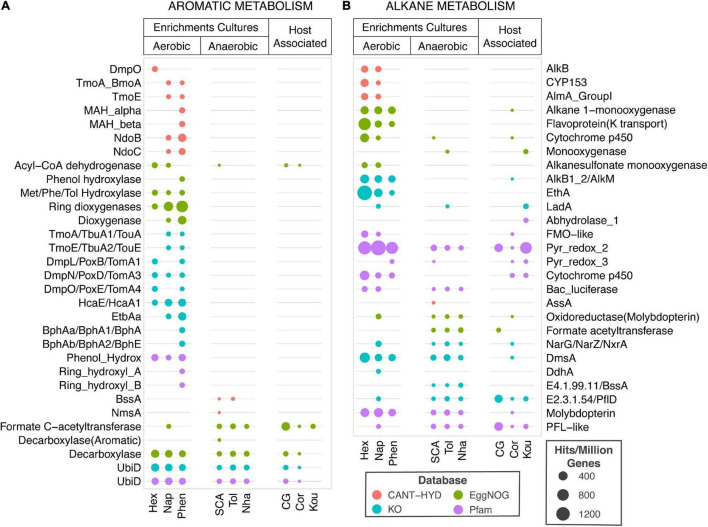
FIGURE 7.
Comparison of hydrocarbon metabolism prediction in metagenomes. Hits to aromatic hydrocarbon (A) and alkane (B) metabolism HMMs (y-axis) from CANT-HYD (red), eggNOG (green), KO (teal), and Pfam (purple) to each metagenome (x-axis) normalized to per million coding genes. The metagenomes (x-axis) are grouped under Enrichment Cultures or Host associated microbiome. The enrichment culture metagenomes representing microbial community grown on under aerobic conditions on hexadecane (Hex), naphthalene (Nap), or phenanthrene (Phen) or under anaerobic conditions on short-chain alkanes (SCA), Toluene (Tol), or Naphtha (Nha). The host-associated microbiomes are from child gut (CG), Coral (Cor), or Koumiss (Kou). The size of the bubble depicts proportion of hydrocarbon degrading genes to total genic content of the metagenome. See Supplementary Table 5 for details regarding the HMMs and the underlying data.

