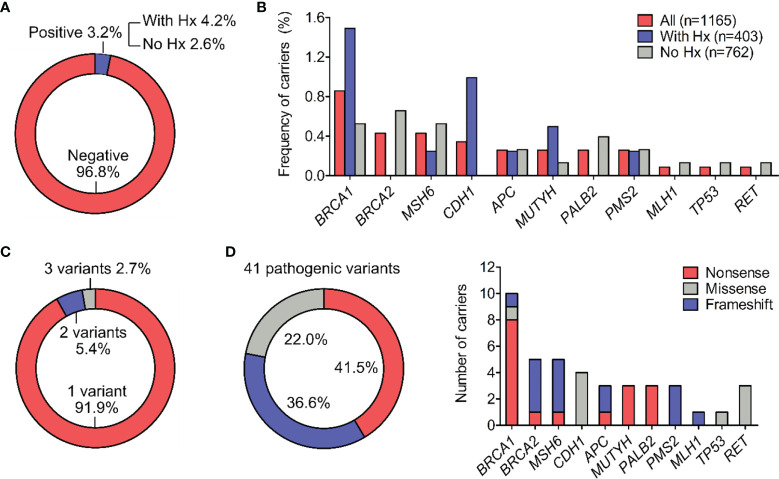
Figure 1.
Types and frequency of all pathogenic variants. (A) Percentage of participants positive for at least one pathogenic variant in the general cohort and in subgroups with or without history (Hx) of cancer. (B) Percentage of pathogenic variant carriers for individual gene. (C) Percentage of carriers (n=37) harboring 1, 2 or 3 pathogenic variants. (D) Distribution of molecular consequences (nonsense, missense and frameshift) among the 41 pathogenic variants. The frequency of different molecular consequences for each gene was illustrated.

