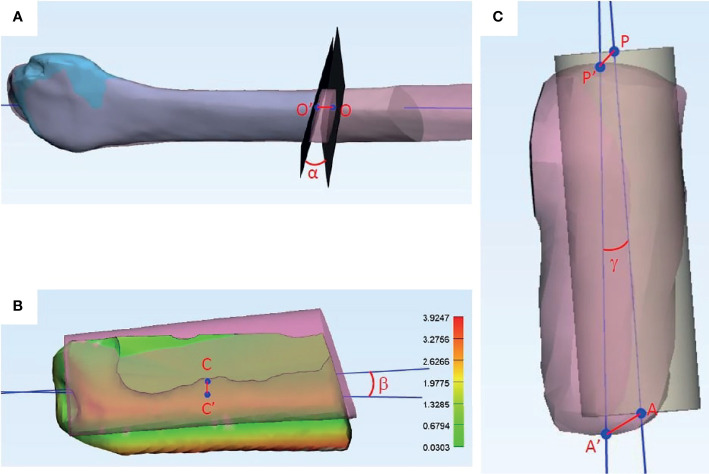
Figure 4.
References used in accuracy analyses. (A) Fibula distal osteotomy accuracy analyses. Blue: Distal end of fibula after harvest. Pink: Fibula in preoperative virtual surgical planning. O: Center of the planned osteotomy plane. O’: Center of the actual osteotomy plane. O-O’: Axial deviation of the osteotomy plane. α: Angle deviation of the osteotomy plane. (B) Reconstruction segment accuracy analyses. Colored: Fibula segment at recipient site in postoperative CT scan. Pink: Fibula segment in preoperative virtual surgical planning. C: Center of the planned fibula segment. C’: Center of the actual fibula segment. C-C’: Center point deviation of the fibula segment. β: Angle deviation of the fibula segment. Absolute distance deviation represented in the color map. (C) Implant accuracy analyses. Yellow cylinder: Implant position in the virtual surgical plan. Pink cylinder: Actual implant position in the postoperative CT scan. P: Center point of implant platform in the virtual surgical plan. P’: Center point of implant platform in the actual implant. A: Apex of the implant in the virtual surgical plan. A’: Apex of actual implant placed. P-P’: Deviation in implant platform position (mm). A-A’: Deviation in implant apex position (mm). γ: Angle deviation of long axes of implants.

