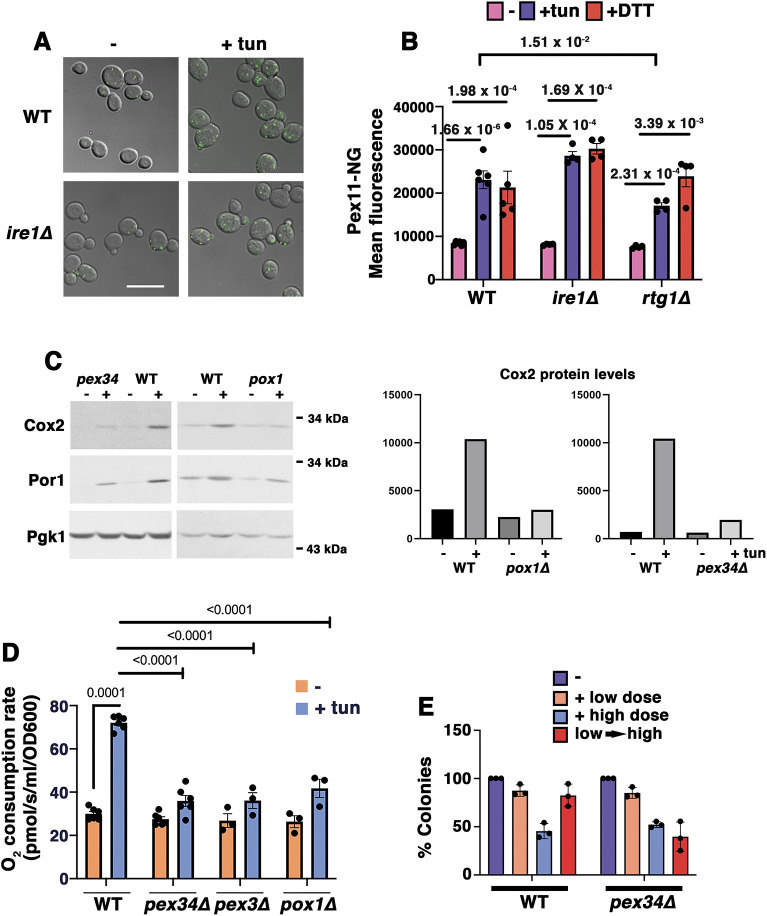
Fig. 1.
Peroxisomes ameliorate ERS. (A) Micrographs showing ERS-induced peroxisome increase, visualized using Pex11–mNeonGreen. Exponentially growing wild-type (WT) and ire1Δ cells were treated with or without ER stressor (0.5 µg/ml tunicamycin; tun) for 5 h. Scale bar: 10 µm. (B) Quantitation of ERS-induced peroxisomal increase by flow cytometry of Pex11–mNeonGreen (Pex11-NG)-labeled cells. Wild-type, ire1Δ and rtg1Δ cells were treated with or without 0.5 µg/ml tunicamycin or 1 mM DTT. Pex11–NG fluorescence was quantitated using flow cytometry. The peroxisomal response to ERS was intact in ire1Δ cells but impaired in rtg1Δ mutants. Data are presented as mean±s.e.m. n≥3 using independent colonies. P values are indicated on the graph (Student's t-test, one-tailed, unpaired). (C) Left: western blots showing low levels of Cox2 protein in pox1Δ and pex34Δ cells compared with levels in WT. Cells were treated with or without 0.5 µg/ml tunicamycin for 5 h. Lysates were normalized using total protein content and blotted with anti-Cox2 and anti-Por1 antibodies. Pgk1 is shown as the loading control. Right: densitometric quantitation of the western blots using ImageJ software. Data are representative of three experiments. (D) Increased O2 consumption in response to ERS requires peroxisomal β-oxidation. Exponentially growing cells were treated with or without 0.5 µg/ml tunicamycin for 5 h. Cellular OCR was measured in a high-resolution respirometer. Data are presented as mean±s.e.m. n≥3 using independent colonies. P values are indicated on the graph (Student's t-test, one-tailed, unpaired). At α=0.01, OCR between untreated and treated pex mutants is statistically insignificant. (E) Pex34 is required for adaptation to ERS. Cells were treated with or without a low dose (0.5 µg/ml) or high dose (10 µg/ml) of tunicamycin for 4 h. Adaptation was assayed by treating cells with low dose tunicamycin for 4 h followed by high dose for 4 h (low→high). Cell viability was quantitated by colony forming assay, as described in the Materials and Methods. Data are presented as mean±s.e.m. n=3 with independent colonies.

