Fig. 2.
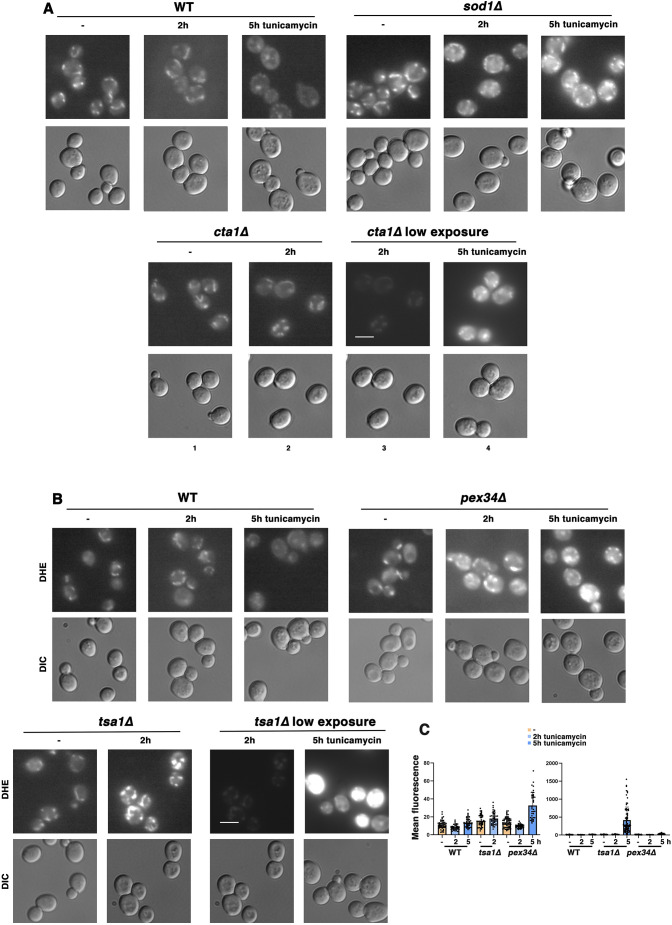
Mitochondrial response to ERS includes amelioration of ROS. (A) ROS amelioration requires superoxide dismutase and catalase activity during ERS. Wild-type (WT), sod1Δ and cta1Δ cells were treated with or without 0.5 µg/ml tunicamycin for 2 h or 5 h. Cells were then stained with DHE (2 µg/ml for 15 min), and fluorescence images (top) were collected at the same exposure and adjusted with Photoshop using the same settings. DIC images are also shown (bottom). In low-exposure images, adjustments were made with Photoshop settings to reduce the fluorescence signal. Scale bar: 10 µm. Images are representative of three experiments. (B) ROS accumulation during ERS is exacerbated in pex34Δ and tsa1Δ cells. Wild-type, pex34Δ and tsa1Δ cells were treated with or without 0.5 µg/ml tunicamycin for 2 h or 5 h, and then stained with DHE as in A. Fluorescence images were collected at the same exposure and adjusted in Photoshop with the same settings. As in A, adjustments were made with Photoshop to reduce to the fluorescence signal in low-exposure images. Scale bar: 10 µm. (C) Quantitation of ROS accumulation shown in B, as described in the Materials and Methods. DHE fluorescence data are presented as mean±s.e.m. n≥38 cells, quantified from at least two distinct fields of view.

