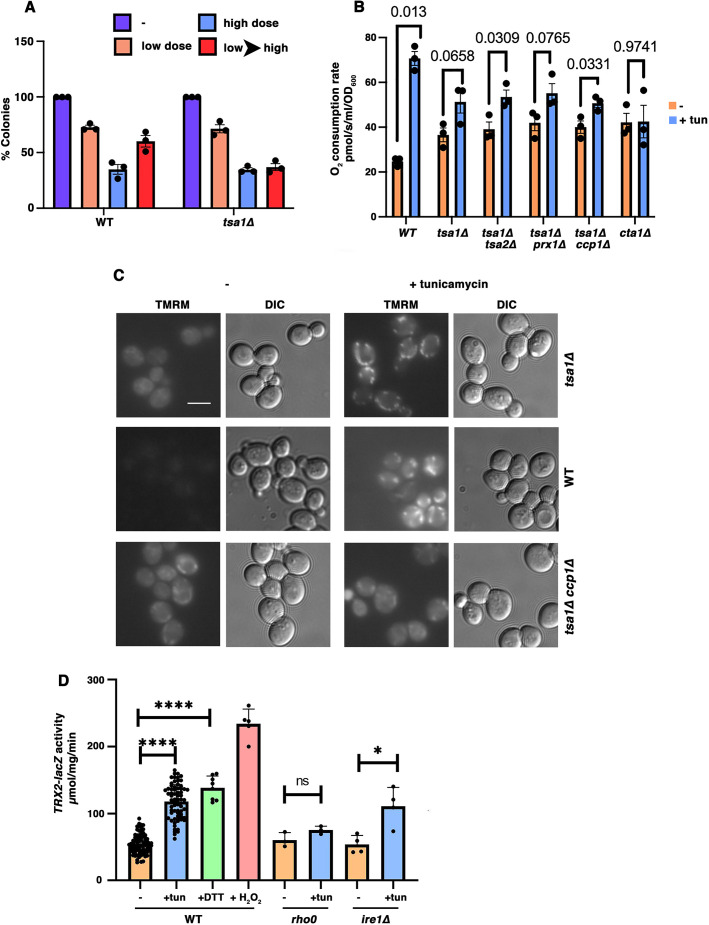
Fig. 4.
Mitochondrial remodeling in response to ERS is redox dependent. (A) Adaptation to ERS. Wild-type (WT) and tsa1Δ cells were treated without and with low dose (0.5 µg/ml) or high dose (10 µg/ml) of tunicamycin for 4 h, or a low dose for 4 h followed by a high dose for 4 h (low→high). Cell viability was determined by colony forming assay, with viability of unstressed wild-type cells expressed as 100%. Data are presented as mean±s.e.m. n=3 with independent colonies. (B) tsa1Δ cells have a constitutively increased OCR with diminished response to ERS. Exponentially growing wild-type, tsa1Δ, tsa1Δ tsa2Δ, tsa1Δ prx1Δ, tsa1Δ ccp1Δ, and cta1Δ cells were treated with or without 0.5 µg/ml tunicamycin for 5 h. Cellular OCR was measured in a high-resolution oxygraph. Data are presented as mean±s.e.m. n=3 with independent colonies. P values are indicated on the graph (Student's t-test, one-tailed, unpaired). (C) MMP is constitutively increased in tsa1Δ and tsa1Δ ccp1Δ cells, with diminished response to ERS. Cells were treated with or without 0.5 µg/ml tunicamycin for 5 h. Live cells were then stained with 5 nM TMRM for 30 min, and fluorescence and DIC images were taken with an Olympus microscope and a Hamamatsu CCD camera. Scale bar: 10 µm. Images are representative of three experiments. (D) Oxidative stress is induced by ERS, as assayed by TRX2-lacZ assay. The indicated cell lines were either untreated (−), treated for 5 h with 0.5 µg/ml tunicamycin (+tun), treated for 5 h with 1 mM DTT (+DTT) or treated for 5 h with 0.5 µM H2O2 (+H2O2). β-galactosidase activity is expressed as µmol/min/mg lysate protein. Data are presented as mean±s.e.m. n≥3. *P≤0.05; ****P≤0.0001; ns, P>0.05 (Student's t-test, one-tailed, unpaired).

